

The World’s Greatest Population Explosion Story
Imagine this: In 1804, there was only 1 billion people on Earth. Fast forward to today, and we’ve surpassed 8 billion humans sharing our planet. That’s an increase of 700% in just over 200 years! But here’s the mind-blowing part – it’s not just about humans. Every species on Earth, from microscopic bacteria to massive blue whales, follows similar population patterns that can make or break entire ecosystems.
Welcome to Unit 3 of AP Environmental Science: Populations – where we dive deep into one of the most fundamental and fascinating aspects of ecology. This unit isn’t just about memorizing graphs and formulas (though we’ll cover those too!). It’s about understanding the invisible forces that shape life on Earth and how human activities are dramatically altering these ancient patterns.

Why should you care about population dynamics? Because they’re literally everywhere around you. The algae bloom that turns your local lake green every summer? Population dynamics. The deer that keep eating your neighbor’s garden plants? Population dynamics. The antibiotic-resistant bacteria that doctors worry about? You guessed it – population dynamics.
In this comprehensive guide, we’ll explore how populations grow, what limits their growth, and why understanding these patterns is crucial for solving some of our biggest environmental challenges. From the mathematical models that predict population changes to real-world conservation success stories, you’ll gain the tools you need to ace the AP Environmental Science exam while developing a deeper appreciation for the intricate web of life that surrounds us.
By the end of this journey, you’ll understand why some populations explode while others crash, how human activities are creating unprecedented population pressures, and what we can do to maintain the delicate balance that keeps our planet’s ecosystems functioning. So grab your calculator and your curiosity – we’re about to embark on an exploration of life’s most fundamental patterns.
Fundamental Concepts: The Building Blocks of Population Science
Understanding Population Basics
Let’s start with the foundation. A population in environmental science refers to all the individuals of a single species living in a specific geographic area at the same time. Think of it as nature’s way of organizing life into manageable groups. The students in your AP Environmental Science class form a population, as do all the oak trees in your local forest or all the bacteria in a petri dish.
But populations aren’t static entities – they’re dynamic, constantly changing systems influenced by four key factors that we call the BIDE factors: Birth rate (natality), Immigration, Death rate (mortality), and Emigration. These factors work together like the controls on a bathtub faucet and drain, determining whether a population grows, shrinks, or remains stable.
Population density measures how crowded organisms are in a given space. It’s calculated simply as the number of individuals divided by the area they occupy. But here’s where it gets interesting – density isn’t just a number on a page. It’s a powerful force that influences everything from how easily organisms find mates to how quickly diseases spread through a population.
The Mathematics of Life: Population Growth Models
Now, let’s dive into the mathematical models that help us predict and understand population changes. Don’t worry – the math isn’t as scary as it might seem, and understanding these models will give you superpowers in predicting ecological outcomes.
Exponential Growth is what happens when a population has unlimited resources and perfect conditions. The population doubles at regular intervals, creating that distinctive J-shaped curve you’ve probably seen in textbooks. The formula is elegantly simple:
Nt = N₀ × e^(rt)
Where:
- Nt = population size at time t
- N₀ = initial population size
- e = mathematical constant (≈2.718)
- r = intrinsic rate of increase
- t = time
Think of exponential growth like a viral TikTok video – it starts with one person sharing, then two people share it, then four, then eight, and before you know it, millions of people have seen it. This is exactly how bacteria reproduce in ideal laboratory conditions or how invasive species can explode when first introduced to a new environment.
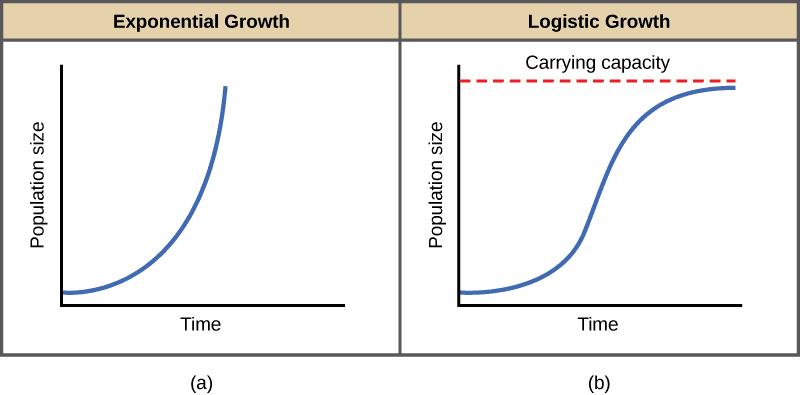
But here’s the reality check: exponential growth can’t continue forever in the real world. Resources run out, space becomes limited, and competition intensifies. This brings us to logistic growth, represented by the famous S-shaped curve.
Logistic growth incorporates the concept of carrying capacity (K) – the maximum number of individuals an environment can sustainably support. The logistic growth equation is:
dN/dt = rN((K-N)/K)
This equation tells us that population growth rate depends not just on the intrinsic growth rate and current population size, but also on how close the population is to its carrying capacity. As the population approaches K, growth slows down and eventually levels off.
Population Regulation: Nature’s Feedback Systems
Populations don’t grow in isolation – they’re regulated by various factors that act like natural thermostats, keeping numbers within sustainable limits. These regulatory factors fall into two main categories: density-dependent and density-independent factors.
Density-dependent factors become more intense as population density increases. These include:
- Competition for resources: As more individuals compete for the same food, water, or nesting sites, survival and reproduction rates decline
- Predation: Higher prey density often leads to increased predator populations
- Disease transmission: Crowded conditions facilitate the spread of pathogens
- Stress and behavioral changes: Overcrowding can trigger physiological stress responses that reduce reproduction
A classic example is the relationship between snowshoe hares and Canadian lynx. As hare populations increase, lynx have more food and their populations grow. But as lynx populations peak, they reduce hare numbers, which then causes lynx populations to crash due to food scarcity. This creates the famous predator-prey cycles that repeat approximately every 10 years.
Density-independent factors affect populations regardless of their density. These include:
- Weather and climate events: Hurricanes, droughts, floods, and extreme temperatures
- Natural disasters: Volcanic eruptions, earthquakes, wildfires
- Human activities: Habitat destruction, pollution, hunting
- Seasonal changes: Temperature fluctuations, daylight patterns
The 2004 Indian Ocean tsunami provides a stark example of density-independent population control, dramatically reducing populations of many coastal species regardless of their pre-tsunami densities.
Survivorship Curves: Life’s Different Strategies
Different species have evolved different strategies for surviving and reproducing, and these strategies are beautifully illustrated by survivorship curves. These graphs show the proportion of individuals surviving at each age for a given species.

Type I survivorship curves characterize species that invest heavily in fewer offspring, providing extensive parental care. Humans, elephants, and most large mammals follow this pattern. Most individuals survive to old age, then mortality increases rapidly. It’s like having a warranty that protects you for most of your life, then expires suddenly.
Type II survivorship curves show constant mortality rates throughout life. Many birds, small mammals, and some reptiles follow this pattern. Think of it as life’s random lottery – your chances of dying are roughly the same whether you’re young or old.
Type III survivorship curves represent the “quantity over quality” strategy. These species produce many offspring but provide little parental care. Most individuals die young, but the few survivors live relatively long lives. Fish, insects, and many plants follow this pattern. It’s nature’s version of throwing spaghetti at the wall to see what sticks.
Reproductive Strategies: r vs. K Selection
Building on survivorship patterns, ecologists classify species based on their reproductive strategies using r-selection and K-selection concepts.

r-selected species are the “live fast, die young” organisms of the natural world. They mature quickly, reproduce early and often, and produce many small offspring with little parental investment. These species thrive in unstable, unpredictable environments where the ability to rapidly colonize new areas is more important than competitive ability. Examples include bacteria, dandelions, mice, and many insects.
K-selected species follow the “slow and steady wins the race” approach. They mature slowly, live longer, and invest heavily in fewer offspring. These species are typically better competitors in stable environments where resources are limited. Examples include elephants, oak trees, humans, and whales.
Most species fall somewhere on a continuum between pure r and K strategies, and some can even shift strategies based on environmental conditions. This flexibility is part of what makes studying population dynamics so fascinating – life finds incredibly creative ways to persist and thrive.
Real-World Applications: Population Dynamics in Action
Case Study 1: The Yellowstone Wolf Reintroduction
One of the most compelling examples of population dynamics in action occurred in Yellowstone National Park. After wolves were eliminated from the park in the 1920s, the ecosystem underwent dramatic changes that illustrate the complex interconnections between populations.
Without wolves, elk populations exploded, reaching unsustainable levels. These large herbivore populations overgrazed vegetation along streams and rivers, leading to erosion and habitat degradation. The absence of this apex predator created what ecologists call a trophic cascade – effects that rippled down through multiple levels of the food web.

When 31 wolves were reintroduced between 1995 and 1997, the effects were swift and dramatic. Elk populations decreased from approximately 17,000 to around 8,000 individuals. But the changes went far beyond simple population numbers. The mere presence of wolves altered elk behavior, forcing them to avoid certain areas and move more frequently. This behavioral change, called the “landscape of fear,” allowed vegetation to recover in previously overgrazed areas.
The recovery of streamside vegetation had cascading effects throughout the ecosystem. Beaver populations rebounded as aspen and willow trees recovered. The increased beaver activity created wetland habitats that supported diverse bird and amphibian populations. Even scavenger populations like ravens and bears benefited from wolf kills.
This case study demonstrates several key population concepts:
- Top-down population control: Predators can regulate prey populations
- Carrying capacity: Elk populations exceeded the park’s carrying capacity in the absence of wolves
- Density-dependent regulation: Competition for food became intense as elk populations grew
- Interconnected population dynamics: Changes in one population affect multiple other species
Case Study 2: The Human Population Explosion
No discussion of population dynamics would be complete without examining our own species. Human population growth provides a fascinating case study in how technological and social changes can override natural population controls.
For most of human history, our population grew slowly, regulated by disease, food scarcity, and natural disasters. Around 1800, global human population reached 1 billion – a milestone that took hundreds of thousands of years to achieve. But then something unprecedented happened: the demographic transition.
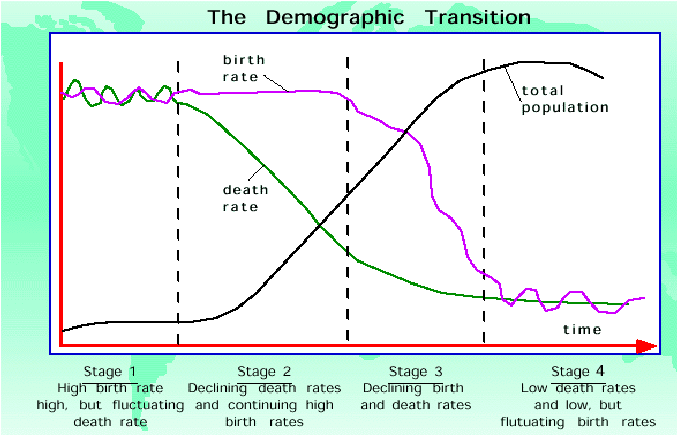
The demographic transition describes the shift from high birth and death rates to low birth and death rates as societies develop economically. This transition typically occurs in four stages:
Stage 1: High birth rates and high death rates result in slow population growth. Most of human history falls into this category.
Stage 2: Death rates decline due to improved healthcare, sanitation, and nutrition, while birth rates remain high. This creates rapid population growth. Many developing countries are currently in this stage.
Stage 3: Birth rates begin to decline as education increases, urbanization occurs, and economic opportunities for women expand. Population growth slows but continues.
Stage 4: Both birth and death rates are low, leading to slow population growth or even population decline. Most developed countries are in this stage.
Currently, different regions of the world are in different stages of this transition. Sub-Saharan Africa is largely in Stage 2, experiencing rapid population growth. Europe and East Asia are in Stage 4, with some countries like Japan facing population decline.
The global implications are staggering. We’re adding approximately 67 million people to the planet each year – equivalent to the entire population of the United Kingdom. This unprecedented growth raises critical questions about carrying capacity, resource consumption, and environmental sustainability.
Case Study 3: Invasive Species and Population Explosions
The introduction of non-native species provides excellent examples of exponential growth in real-world situations. When species are introduced to new environments without their natural predators, diseases, or competitors, they can exhibit explosive population growth that devastates local ecosystems.

The Burmese Python in the Everglades exemplifies this phenomenon. These large constrictor snakes, native to Southeast Asia, were introduced to South Florida through the pet trade. Released or escaped pythons found the Everglades to be an ideal habitat – warm, wet, and full of prey species that had no evolutionary experience with large constrictor snakes.
Since the 1980s, Burmese python populations have exploded exponentially. Current estimates suggest tens of thousands of pythons now inhabit the Everglades. Their impact on native wildlife has been catastrophic:
- Small mammal populations have declined by 85-95% in areas with established python populations
- Bird populations have decreased significantly
- Some native reptile and amphibian species have experienced severe population crashes
This case illustrates several important concepts:
- Exponential growth in the absence of natural population controls
- Competitive exclusion as pythons outcompete native predators
- Predation pressure on naive prey species
- The importance of environmental resistance in natural population regulation
Zebra Mussels in the Great Lakes provide another compelling example. These small freshwater mollusks, native to Eastern Europe, were introduced to the Great Lakes in the 1980s through ballast water from ships. Within a decade, they had spread throughout all five Great Lakes and into connecting waterways.
Zebra mussels exhibit classic r-selected characteristics: rapid reproduction, high dispersal ability, and tolerance for various environmental conditions. A single female can produce up to one million eggs per year, and their planktonic larvae can be transported long distances by water currents.
Their exponential population growth has had enormous ecological and economic impacts:
- They filter massive amounts of water, removing plankton that forms the base of aquatic food webs
- They’ve caused shifts in nutrient cycling and water clarity
- They clog water intake pipes, costing millions of dollars in maintenance
- They’ve contributed to harmful algal blooms by altering nutrient dynamics
Case Study 4: Conservation Success Stories
Not all population stories are tales of decline or invasion. Conservation efforts have led to remarkable population recoveries that demonstrate our ability to positively influence population dynamics.
The California Condor Recovery Program represents one of conservation’s greatest success stories. In 1987, the California condor population had crashed to just 27 individuals worldwide – the lowest point for any bird species that has subsequently recovered.
The recovery program involved:
- Capturing all remaining wild birds for captive breeding
- Intensive veterinary care and genetic management
- Hand-rearing chicks using puppet parents to prevent human imprinting
- Addressing threats like lead poisoning from ammunition in gut piles
- Gradually releasing captive-bred birds back to the wild
Today, over 500 California condors exist, with more than 300 flying free in California, Arizona, Utah, and Baja California, Mexico. This represents exponential growth from the bottleneck population, demonstrating that intensive management can overcome even severe population crashes.
The program illustrates several key concepts:
- Minimum viable population: The critical population size needed for long-term survival
- Genetic bottlenecks: How small populations lose genetic diversity
- Captive breeding: Using controlled reproduction to increase population size
- Habitat management: Addressing environmental factors that limit population growth
Environmental Connections: Populations in the Web of Life
Population Dynamics and Climate Change
Climate change represents one of the most significant challenges to population dynamics in the modern era. As global temperatures rise and weather patterns shift, species face unprecedented pressures that are reshaping population distributions and abundances worldwide.
Temperature-Dependent Population Effects are perhaps the most direct climate impacts. Many species have narrow temperature tolerance ranges, and even small changes can have dramatic effects. For example, sea turtle populations are particularly vulnerable because sex determination is temperature-dependent. Warmer sand temperatures produce more female hatchlings, potentially skewing sex ratios and threatening long-term population viability.
Coral populations provide another stark example. Rising ocean temperatures trigger coral bleaching, a stress response where corals expel the symbiotic algae they depend on for nutrition. Repeated bleaching events have caused massive coral mortality, with some reef systems losing over 50% of their coral cover in just a few years.
Phenological Mismatches occur when climate change alters the timing of biological events. Many bird species time their breeding seasons to coincide with peak insect abundance for feeding their chicks. However, warming temperatures are causing insects to emerge earlier in the spring while bird migration patterns haven’t adjusted accordingly. This temporal mismatch can lead to reduced breeding success and population declines.
Range Shifts represent another major climate impact on populations. As temperatures warm, species are moving toward higher latitudes and elevations to track suitable climate conditions. Mountain-dwelling species face particular challenges because they can only move so far upslope before running out of habitat. This “escalator to extinction” effect is already causing local population extinctions in high-elevation ecosystems.
The Arctic provides a compelling example of climate-driven range shifts. As sea ice extent declines, polar bear populations are losing critical hunting habitat. Some populations have already experienced significant declines, while others are showing signs of nutritional stress and reduced reproductive success.
Pollution and Population Health
Chemical pollution creates both density-dependent and density-independent effects on populations. Bioaccumulation and biomagnification of toxic substances can have particularly severe impacts on predator populations at the top of food webs.
The history of DDT and bird populations illustrates these concepts perfectly. DDT was widely used as an insecticide from the 1940s through the 1970s. While it didn’t directly kill adult birds, it caused eggshell thinning that led to high embryonic mortality. Populations of predatory birds like peregrine falcons, bald eagles, and brown pelicans crashed to critically low levels.
The ban on DDT in the United States led to remarkable population recoveries. Bald eagle populations have grown from fewer than 500 breeding pairs in the lower 48 states in the 1960s to over 300,000 individuals today. This success story demonstrates how addressing pollution can allow natural population recovery.
Endocrine disruptors represent a modern pollution challenge affecting population dynamics. These chemicals interfere with hormone systems, potentially affecting reproduction, development, and behavior. Atrazine, a common herbicide, has been shown to cause hermaphroditism in frogs and reduce reproductive success in some bird species.
Plastic pollution is creating new challenges for marine populations. Seabirds mistake plastic debris for food, filling their stomachs with indigestible materials and reducing their ability to consume nutritious prey. Microplastics in the food web may have subtler but widespread effects on population health that scientists are just beginning to understand.
Habitat Fragmentation and Population Dynamics
Habitat fragmentation – the breaking up of continuous habitats into smaller, isolated patches – has profound effects on population dynamics. Fragmentation doesn’t just reduce habitat area; it fundamentally changes how populations function and interact.
Edge effects occur at the boundaries between habitat patches and adjacent areas. These edges often have different microclimates, vegetation, and predator-prey dynamics than habitat interiors. For species adapted to interior conditions, edge effects can reduce the effective size of habitat patches well below their actual area.
Population fragmentation occurs when once-continuous populations become divided into smaller, isolated subpopulations. These smaller populations face several challenges:
- Reduced genetic diversity due to smaller breeding pools
- Increased vulnerability to stochastic events like disease outbreaks or natural disasters
- Difficulty finding mates in sparse populations
- Loss of beneficial population interactions like group foraging or predator detection
The metapopulation concept provides a framework for understanding fragmented populations. A metapopulation consists of multiple local populations connected by occasional migration. Even if individual patches experience local extinctions, the metapopulation can persist through recolonization from other patches.
Forest fragmentation in the Amazon illustrates these concepts on a massive scale. As forests are cleared for agriculture and development, remaining forest patches become increasingly isolated. Studies have shown that fragmented forests lose species over time, with smaller patches losing more species than larger ones. This “relaxation effect” can continue for decades after fragmentation occurs.
Urban Environments and Population Adaptations
Cities create unique environments that filter species based on their ability to adapt to urban conditions. Urban populations often show remarkable adaptations to city life, providing insights into rapid evolutionary change.
Urban-adapted populations often exhibit different characteristics than their rural counterparts:
- Behavioral adaptations: City birds often sing at higher frequencies to be heard over traffic noise
- Dietary flexibility: Urban species typically have more varied diets, taking advantage of human food sources
- Reduced fear responses: Urban animals often show less fear of humans and novel stimuli
- Alterations in stress physiology: Some urban species show chronic stress responses while others appear to have adapted their stress systems
Peregrine falcons provide an excellent example of urban adaptation. These raptors have colonized cities worldwide, nesting on skyscrapers and hunting the abundant pigeon populations. Urban peregrine populations often have higher reproductive success than rural populations due to abundant prey and reduced competition.
However, urban environments also create novel challenges:
- Light pollution can disrupt circadian rhythms and navigation
- Chemical pollution from vehicles and industry affects population health
- Collisions with buildings and vehicles create new sources of mortality
- Heat island effects can create thermal stress
Current Research and Trends: The Cutting Edge of Population Science
Technological Advances in Population Monitoring
The field of population ecology is being revolutionized by new technologies that allow scientists to monitor populations with unprecedented precision and scale. These advances are providing insights that were impossible just a decade ago.
Remote sensing and satellite technology now enable researchers to track population changes across vast areas. Scientists can monitor deforestation impacts on wildlife populations, track animal migrations from space, and detect habitat changes that affect population dynamics. For example, researchers use satellite imagery to identify elephant populations in Africa by counting individuals in high-resolution images, providing population estimates for remote areas that would be impossible to survey on foot.
Environmental DNA (eDNA) represents another breakthrough technology. All organisms shed genetic material into their environment through skin cells, feces, and other biological materials. By sampling water or soil and analyzing the DNA present, scientists can detect species presence and even estimate population sizes without ever seeing the organisms themselves. This technique is particularly valuable for monitoring aquatic species and rare or cryptic species.
Camera traps and automated monitoring systems are providing 24/7 insights into wildlife populations. Modern camera traps can be equipped with AI-powered image recognition software that automatically identifies species and individuals, creating massive datasets on population behavior and abundance. Some systems can even distinguish individual animals based on unique markings or patterns.
GPS and satellite telemetry allow researchers to track individual animals throughout their lives, providing insights into survival rates, reproduction, and habitat use. These data are crucial for understanding the factors that drive population changes and for developing effective conservation strategies.
Climate Change and Population Predictions
Current research is focused on understanding how climate change will affect population dynamics in the coming decades. Species distribution modeling combines climate data with species occurrence records to predict how populations will shift as climate patterns change.

These models suggest that many species will need to move hundreds of kilometers toward the poles or thousands of meters upslope to track suitable climate conditions. However, human development, habitat fragmentation, and natural barriers may prevent many species from making these necessary movements.
Phenological studies are revealing widespread changes in the timing of biological events. Spring is arriving earlier in many parts of the world, causing plants to leaf out and bloom sooner. This affects the entire food web, as insects, birds, and mammals must adjust their life cycles to match changing resource availability.
Research on climate refugia – areas that remain climatically suitable even as surrounding areas become unsuitable – is informing conservation planning. Identifying and protecting these refugia may be crucial for maintaining populations through climate transitions.
Genomics and Population Genetics
Advances in genomic technology are providing new insights into population dynamics and evolutionary processes. Population genomics allows scientists to understand genetic diversity within populations, identify populations at risk of inbreeding depression, and track gene flow between populations.
Adaptive genomics research is revealing how populations adapt to environmental changes at the genetic level. Scientists can now identify specific genes that help populations survive in particular environments and track how these genes spread through populations over time.
This research has important conservation implications. Genetic rescue – introducing individuals from genetically diverse populations to boost the genetic health of inbred populations – is becoming a valuable conservation tool. The Florida panther population was saved from extinction through genetic rescue, with the introduction of Texas cougars helping to restore genetic diversity and population health.
Microbiome Research and Population Health
Emerging research on the microbiome – the community of microorganisms living in and on larger organisms – is revealing new connections between individual health and population dynamics. The health of an organism’s microbiome can affect its immune system, nutrition, and reproduction, ultimately influencing population-level patterns.
For example, research on coral reefs is showing that healthy coral microbiomes are essential for coral survival and reproduction. Climate change and pollution can disrupt these microbial communities, contributing to coral bleaching and mortality. Understanding these microbial interactions may be key to developing strategies for coral conservation.
Similarly, research on amphibian populations has revealed that skin microbiomes can protect against fungal diseases that have caused widespread population declines. Conservation efforts are now focusing on maintaining healthy microbial communities as part of population recovery programs.
Artificial Intelligence and Population Modeling
Machine learning and artificial intelligence are transforming population ecology by enabling researchers to analyze vast datasets and identify patterns that would be impossible to detect manually. AI systems can process millions of camera trap images, acoustic recordings, and satellite images to monitor population changes across landscapes.
Predictive modeling using AI is becoming increasingly sophisticated, incorporating multiple environmental variables, species interactions, and human impacts to forecast population trends. These models are essential for conservation planning and for understanding how populations might respond to different management scenarios.
Citizen science projects are leveraging smartphone technology and AI to engage millions of people in population monitoring. Apps like eBird, iNaturalist, and Merlin Bird ID allow anyone to contribute population data while AI systems help verify identifications and detect trends in the crowdsourced data.
Study Guide Section: Mastering Population Dynamics for the AP Exam
Key Formulas and Calculations
Understanding the mathematical relationships in population ecology is crucial for AP Environmental Science success. Here are the essential formulas you need to know:
Key Population Formulas:
* Exponential Growth: Nt = N₀ × e^(rt)
* Logistic Growth: dN/dt = rN((K-N)/K)
* Doubling Time: td = 0.693/r
Population Growth Rate:
- r = (births + immigration) – (deaths + emigration) / N
- Where r = per capita growth rate, N = population size
Exponential Growth:
- Nt = N₀ × e^(rt) or Nt = N₀ × (1 + r)^t
- Nt = population at time t, N₀ = initial population, r = growth rate, t = time
Logistic Growth:
- dN/dt = rN((K-N)/K)
- K = carrying capacity
Doubling Time:
- td = 0.693/r (for exponential growth)
- td = 70/r (rule of 70, when r is expressed as a percentage)
Population Density:
Image Credit – ResearchGate
- Density = Number of individuals / Area
Memory Aids and Study Tips
“BIDE Your Time” – Remember the four factors affecting population size:
- Birth rate (natality)
- Immigration
- Death rate (mortality)
- Emigration
“J vs. S Curves” – Visual memory aid:
- J-curve = Exponential growth = “Just keeps going up”
- S-curve = Logistic growth = “Starts slow, Speeds up, then Stops”
“Types 1-2-3, Easy as A-B-C” – Survivorship curves:
- Type I = Humans and large mammals = “Live long and prosper”
- Type II = Birds and small mammals = “Life’s a constant gamble”
- Type III = Fish and insects = “Throw everything at the wall”
“r vs. K Selection” – Memory device:
- r-selected = “Race to reproduce” (rabbits, bacteria, weeds)
- K-selected = “Keep it in the family” (elephants, humans, oak trees)
Common Exam Mistakes to Avoid
- Confusing exponential and logistic growth: Remember that exponential growth creates a J-curve and assumes unlimited resources, while logistic growth creates an S-curve and includes carrying capacity.
- Mixing up density-dependent and density-independent factors: Density-dependent factors get stronger as population density increases (competition, predation, disease). Density-independent factors affect populations regardless of density (weather, natural disasters).
- Forgetting about environmental resistance: Real populations can’t grow exponentially forever. Always consider what factors might limit population growth.
- Misinterpreting survivorship curves: Type III doesn’t mean the species dies young – it means most individuals die young, but survivors can live long lives.
- Confusing immigration/emigration:
- Immigration = moving IN to a population
- Emigration = moving EXIT from a population
Quick Review Checklist
Before the exam, make sure you can:
✓ Draw and label exponential and logistic growth curves
✓ Identify factors that would shift a population from exponential to logistic growth
✓ Calculate population growth rates and doubling times
✓ Distinguish between r-selected and K-selected species
✓ Explain how density-dependent factors regulate populations
✓ Interpret survivorship curves and explain what they reveal about life history strategies
✓ Connect population concepts to real-world environmental issues
✓ Analyze data tables and graphs showing population changes over time
Connecting Concepts Across Units
Population dynamics don’t exist in isolation – they connect to virtually every other topic in AP Environmental Science:
Unit 1 (The Living World): Population concepts are fundamental to understanding ecosystem energy flow and nutrient cycling.
Unit 2 (The Living World: Biodiversity): Population dynamics affect biodiversity patterns and species interactions.
Unit 4 (Earth Systems and Resources): Soil, water, and mineral resources set carrying capacities for populations.
Unit 5 (Land and Water Use): Human land use practices directly impact wildlife population dynamics.
Unit 6 (Energy Resources and Consumption): Energy availability affects population growth and carrying capacity.
Unit 7 (Atmospheric Pollution): Air pollution can act as a density-independent factor affecting populations.
Unit 8 (Aquatic and Terrestrial Pollution): Pollutants can disrupt reproduction and survival in populations.
Unit 9 (Global Change): Climate change is reshaping population distributions and dynamics worldwide.
Practice Questions: Test Your Understanding
Multiple Choice Questions
1. Which of the following best describes the difference between exponential and logistic population growth?
a) Exponential growth occurs in small populations; logistic growth occurs in large populations
b) Exponential growth assumes unlimited resources; logistic growth includes environmental resistance
c) Exponential growth is slower than logistic growth
d) Logistic growth produces a J-shaped curve; exponential growth produces an S-shaped curve
e) There is no significant difference between the two models
2. A population of bacteria doubles every 20 minutes. If the initial population is 100 bacteria, how many bacteria will be present after 2 hours?
a) 800
b) 1,600
c) 3,200
d) 6,400
e) 12,800
3. Which of the following is a density-dependent factor that regulates population growth?
a) Earthquake
b) Hurricane
c) Competition for food
d) Volcanic eruption
e) Seasonal temperature changes
4. Type III survivorship curves are characteristic of species that:
a) Provide extensive parental care
b) Have high survival rates throughout life
c) Produce many offspring with little parental investment
d) Live in stable environments
e) Are K-selected species
5. The reintroduction of wolves to Yellowstone National Park resulted in:
a) Exponential growth of elk populations
b) Decreased biodiversity in riparian areas
c) A trophic cascade affecting multiple species
d) Elimination of all elk from the park
e) No measurable ecological changes
6. Which reproductive strategy is associated with r-selected species?
a) Long lifespan and late maturation
b) Large body size and few offspring
c) Extensive parental care
d) Rapid reproduction and early maturation
e) Stable population sizes near carrying capacity
7. The demographic transition model describes:
a) Seasonal changes in birth and death rates
b) The shift from high birth and death rates to low birth and death rates
c) Migration patterns in human populations
d) The relationship between population density and growth rate
e) Changes in age structure over time
8. Which of the following best explains why invasive species often exhibit exponential growth when first introduced?
a) They have higher reproductive rates than native species
b) They lack natural predators, competitors, and diseases
c) They are always r-selected species
d) They prefer disturbed habitats
e) They have better genetic diversity
Free Response Questions
Question 1 (10 points):
A small island has a population of 200 rabbits. The rabbits have an intrinsic growth rate (r) of 0.5 per year, and the island’s carrying capacity for rabbits is estimated to be 1,000 individuals.
(a) Calculate the expected rabbit population after 2 years assuming exponential growth. Show your work. (3 points)
(b) Explain why exponential growth is unlikely to continue for the full 2 years in this scenario. (2 points)
(c) Describe two density-dependent factors that would likely regulate the rabbit population as it approaches carrying capacity. (2 points)
(d) Sketch a graph showing how you would expect the rabbit population to change over 5 years, labeling the axes and indicating the carrying capacity. (3 points)
Question 2 (10 points):
The graph below shows population changes for three different species over time.
[Description of suggested graph: Three lines showing different population patterns – one showing exponential growth (J-curve), one showing logistic growth (S-curve), and one showing population cycles with regular peaks and valleys]
(a) Identify which line represents exponential growth and explain the conditions that would allow this type of growth. (3 points)
(b) Identify which line represents logistic growth and explain what causes the population to level off. (3 points)
(c) Identify which line represents population cycles and explain what type of species interaction might cause this pattern. (2 points)
(d) For the species showing exponential growth, predict what would happen to the population if it continued growing at the same rate for several more years. Justify your prediction. (2 points)
Question 3 (10 points):
Climate change is affecting population dynamics of many species worldwide.
(a) Explain how rising temperatures might affect a population with temperature-dependent sex determination, such as sea turtles. Include the potential consequences for population persistence. (4 points)
(b) Describe how changing precipitation patterns might serve as a density-independent factor affecting plant populations in a desert ecosystem. (3 points)
(c) Explain how phenological mismatches caused by climate change could affect the population dynamics of migratory bird species. (3 points)
Answer Key and Explanations
Multiple Choice Answers:
- b) Exponential growth assumes unlimited resources; logistic growth includes environmental resistance
- d) 6,400 (100 × 2^6, since there are 6 twenty-minute periods in 2 hours)
- c) Competition for food (becomes more intense as population density increases)
- c) Produce many offspring with little parental investment
- c) A trophic cascade affecting multiple species
- d) Rapid reproduction and early maturation
- b) The shift from high birth and death rates to low birth and death rates
- b) They lack natural predators, competitors, and diseases
Free Response Sample Answers:
Question 1:
(a) Nt = N₀ × e^(rt) = 200 × e^(0.5×2) = 200 × e^1 = 200 × 2.718 = 544 rabbits
(b) Exponential growth assumes unlimited resources, but as the population grows, competition for food, water, and nesting sites will increase. The population will approach the carrying capacity of 1,000, causing growth to slow.
(c) Two density-dependent factors: (1) Competition for food – as more rabbits compete for limited vegetation, individual survival and reproduction will decrease. (2) Increased predation – higher rabbit density may attract more predators or make rabbits easier to find.
(d) Graph should show initial exponential growth followed by slowing growth as population approaches 1,000 (carrying capacity), creating an S-shaped curve.
Conclusion: Your Journey into Population Dynamics
Congratulations! You’ve just completed a comprehensive journey through one of the most fundamental concepts in environmental science. Population dynamics form the foundation for understanding how life on Earth persists, adapts, and responds to changing conditions. The mathematical models, ecological principles, and real-world examples we’ve explored together provide you with powerful tools for analyzing environmental challenges and predicting how species might respond to future changes.
Remember that population ecology isn’t just about numbers and graphs – it’s about understanding the intricate web of relationships that sustain life on our planet. Every time you see deer in your neighborhood, notice birds at a feeder, or read about conservation efforts, you’re witnessing population dynamics in action. The concepts you’ve learned help explain why some species thrive while others struggle, and how human activities are reshaping population patterns across the globe.
As you prepare for the AP Environmental Science exam, keep in mind that population dynamics connect to virtually every other topic in the course. Understanding these connections will serve you well not only on the exam but throughout your future studies and career. Whether you pursue environmental science, biology, policy, or any other field, the ability to think systematically about populations and their interactions with the environment is invaluable.
The challenges facing populations today – from climate change to habitat loss to pollution – require the next generation of environmental scientists to think creatively and act decisively. By mastering these concepts, you’re preparing yourself to be part of the solution to some of our planet’s most pressing environmental challenges.
Additional Resources for Continued Learning
Textbooks and Academic Resources:
- “Campbell Biology” by Urry et al. – Comprehensive coverage of population ecology principles
- “Ecology: From Individuals to Ecosystems” by Begon et al. – Excellent in-depth treatment of population dynamics
- “Conservation Biology” by Sodhi and Ehrlich – Applications of population concepts to conservation
Online Resources:
- Khan Academy Environmental Science – Free video lessons on population ecology
- Coursera Ecology Courses – University-level courses from institutions like Yale and Duke
- Nature Education Scitable – Peer-reviewed articles on population biology topics
Research Organizations:
- Ecological Society of America (ESA) – Professional organization with educational resources
- Society for Conservation Biology – Focus on applied population ecology
- International Union for Conservation of Nature (IUCN) – Global conservation status assessments
Citizen Science Opportunities:
- eBird – Contribute to bird population monitoring
- iNaturalist – Document biodiversity and contribute to population studies
- Christmas Bird Count – Participate in the world’s longest-running citizen science project
Keep exploring, keep questioning, and remember that understanding population dynamics is your key to understanding how life on Earth works. The future of our planet’s incredible biodiversity may well depend on people like you who take the time to understand these fundamental ecological principles. Good luck on your AP exam and in your future environmental endeavors!
Recommended –
1 thought on “AP Environmental Science Unit 3: Populations – Complete Guide to Mastering the Exam”