

Picture this: You’re hiking through a forest, and you notice something fascinating. The towering oak trees seem to “talk” to smaller plants below through an intricate network of fungi in the soil. Nearby, a woodpecker taps rhythmically on dead wood, creating homes not just for itself, but for dozens of other species. This isn’t just nature being beautiful – it’s Ecology in action, and it’s exactly what you’ll master in AP Biology Unit 8.
If you’ve ever wondered why some ecosystems thrive while others collapse, or how a single species can transform an entire landscape, you’re about to dive into one of biology’s most dynamic fields. Ecology represents 10-15% of your AP Biology exam, making it a significant chunk of your final score. But here’s the good news: ecology concepts often feel more intuitive than molecular biology because you can observe them in your daily life.
Learning Objectives: What You’ll Master
By the end of this unit, you’ll confidently tackle these College Board learning objectives:
- EVO-3.E: Explain how the environment and environmental changes affect organisms or populations
- ENE-1.A: Explain how the availability of resources influences species interactions
- ENE-1.B: Describe modes of nutrition and energy capture
- ENE-1.C: Explain how environmental factors affect energy capture
- ENE-1.D: Describe the effects of ecosystems on organisms and populations
- ENE-1.E: Explain how organisms interact in communities
- ENE-1.F: Explain how environmental changes affect communities
- ENE-1.G: Explain how changes in ecosystems affect populations
Real-World Connection: These aren’t just academic concepts. Understanding ecology helps you make sense of climate change news, conservation efforts, and even urban planning decisions in your community.
Energy Flow: The Foundation of All Ecosystems
Understanding Trophic Levels and Energy Transfer
Imagine your school cafeteria as an ecosystem. The lunch staff represents producers, creating “Ecology” (food) from raw materials. You and your classmates are primary consumers, directly using this energy. The teachers supervising lunch? They’re like secondary consumers, maintaining order in the system but not directly consuming the cafeteria’s primary output.
This analogy captures the essence of trophic levels – the feeding positions organisms occupy in food webs. Let’s break down each level:
Producers (Autotrophs) form the foundation of virtually every ecosystem. These organisms, primarily plants, algae, and certain bacteria, capture energy from the sun or chemical sources and convert it into organic compounds. In terrestrial ecosystems, think of grass in a prairie or trees in a forest. In aquatic systems, phytoplankton microscopic floating plants serve this crucial role.
Primary Consumers (Herbivores) directly feed on producers. These range from tiny zooplankton in oceans to massive elephants on African savannas. What unites them is their ability to extract energy from plant matter, often requiring specialized digestive systems to break down cellulose.
Secondary Consumers feed on primary consumers. This group includes carnivores like hawks, bass fish, and wolves, as well as omnivores that consume both plants and animals. Their role involves controlling herbivore populations while transferring energy up the food chain.
Tertiary Consumers sit at the top of most food chains. These apex predators, like great white sharks, eagles, and tigers, typically have few natural enemies and play crucial roles in maintaining ecosystem balance.
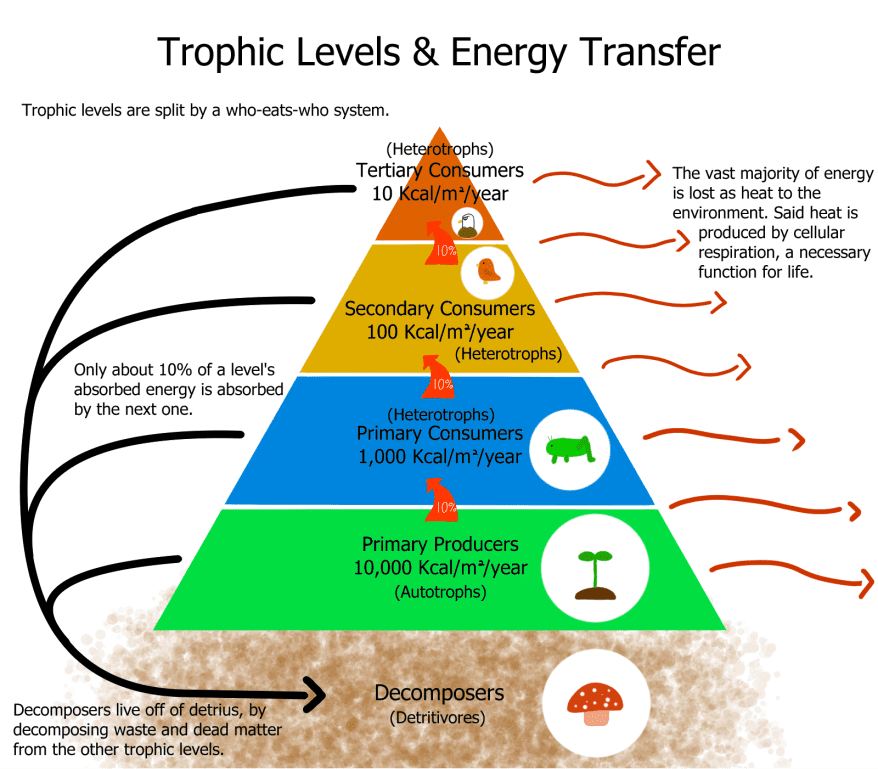
The 10% Rule and Energy Efficiency
Here’s where ecology gets mathematically precise. The 10% Rule states that only about 10% of energy transfers from one trophic level to the next. This isn’t just a rough estimate – it’s a fundamental constraint that shapes ecosystem structure.
Why only 10%? The answer lies in metabolic inefficiency. When a rabbit eats grass, it doesn’t magically transform 100% of that plant energy into rabbit tissue. Most energy gets lost through:
- Cellular respiration (about 90% of consumed energy)
- Heat production during metabolic processes
- Excretion of undigested materials
- Movement and other life activities
This energy loss explains why food chains rarely exceed five trophic levels. By the time energy reaches a fifth level, there’s simply too little left to support viable populations.
Study Tip: Use the “90% waste, 10% gain” rule to quickly calculate energy available at different trophic levels on exam questions. If producers have 10,000 kcal, primary consumers have 1,000 kcal, secondary consumers have 100 kcal, and so on.
Biomass and Energy Pyramids
Understanding energy flow requires distinguishing between energy pyramids and biomass pyramids. While energy always decreases as you move up trophic levels, biomass patterns can sometimes surprise you.
Energy pyramids always show decreasing energy content at higher trophic levels due to the 10% rule. These pyramids never invert because energy cannot be created or recycled – it flows through ecosystems and eventually dissipates as heat.
Biomass pyramids usually follow the same pattern, but they can occasionally invert. In aquatic ecosystems, you might find situations where zooplankton (primary consumers) temporarily outweigh phytoplankton (producers) in terms of total biomass. This happens because phytoplankton reproduce so rapidly that they can support larger consumer populations despite having low biomass at any given moment.
Quick Check: Can you explain why a grassland might support thousands of zebras but only a few lions, while an aquatic ecosystem might temporarily have more fish than algae by weight?
Biogeochemical Cycles: Nature’s Recycling Systems
Unlike energy, which flows through ecosystems in one direction, matter cycles continuously through living and non-living components. These biogeochemical cycles ensure that essential elements remain available for life processes across generations.
The Carbon Cycle: From Atmosphere to Organisms and Back
Carbon cycling represents one of ecology’s most critical processes, especially given current climate change concerns. Let’s trace carbon’s journey through an ecosystem:
Atmospheric Carbon Dioxide serves as the starting point for most carbon cycling. Plants absorb CO₂ during photosynthesis, converting it into glucose and other organic compounds. This process removes approximately 120 gigatons of carbon from the atmosphere annually.
Biological Carbon Storage occurs in plant tissues, from leaves to massive tree trunks. When herbivores consume plants, carbon transfers to animal tissues. Decomposers eventually break down dead organisms, releasing CO₂ back to the atmosphere through cellular respiration.
Oceanic Carbon Exchange involves complex interactions between atmospheric CO₂ and seawater. Oceans absorb roughly 25% of human-produced CO₂ emissions, but this process acidifies seawater, affecting marine ecosystems.
Geological Carbon Storage locks carbon away in fossil fuels, limestone, and other rock formations over geological timescales. Human activities have accelerated the release of this stored carbon, disrupting natural cycling patterns.

The Nitrogen Cycle: Essential Element Transformation
Nitrogen presents a fascinating paradox: it comprises 78% of Earth’s atmosphere, yet most organisms cannot use atmospheric nitrogen directly. This limitation makes the nitrogen cycle crucial for ecosystem productivity.
Nitrogen Fixation converts atmospheric N₂ into ammonia (NH₃) or ammonium (NH₄⁺) that organisms can use. Specialized bacteria, either free-living or symbiotic (like those in legume root nodules), perform this energy-intensive process. Lightning also fixes small amounts of nitrogen naturally.
Nitrification involves soil bacteria converting ammonia to nitrites (NO₂⁻) and then to nitrates (NO₃⁻). Plants readily absorb nitrates, making this step crucial for primary productivity.
Assimilation occurs when plants incorporate nitrogen compounds into amino acids, proteins, and nucleic acids. Animals obtain nitrogen by consuming plants or other animals.
Mineralization or ammonification happens when decomposer bacteria break down organic nitrogen compounds in dead organisms, releasing ammonia back to the soil.
Denitrification completes the cycle as specialized bacteria convert nitrates back to atmospheric nitrogen gas under anaerobic conditions.
Common Mistake Alert: Students often forget that atmospheric nitrogen (N₂) cannot be used directly by most organisms. Only certain bacteria can fix atmospheric nitrogen, making them essential ecosystem components.
The Phosphorus Cycle: The Limiting Factor
Unlike carbon and nitrogen, phosphorus lacks a significant atmospheric component, making its cycle entirely terrestrial and aquatic. This characteristic often makes phosphorus the limiting nutrient in freshwater ecosystems.
Weathering releases phosphorus from rocks into soil and water systems. This process occurs slowly, making phosphorus availability a long-term constraint on ecosystem productivity.
Biological Uptake involves plants absorbing phosphate ions (PO₄³⁻) from soil. Animals obtain phosphorus by consuming plants or other animals.
Decomposition returns phosphorus to soil when organisms die and decompose. However, much phosphorus eventually flows to oceans, where it becomes incorporated into sediments.
Human Impact on phosphorus cycling includes mining phosphate rock for fertilizers and detergents, often leading to eutrophication when excess phosphorus enters water systems.
The Water Cycle: Connecting All Ecosystems
Water cycling connects terrestrial and aquatic ecosystems while driving weather patterns that influence all life on Earth.
Evaporation from oceans, lakes, and rivers converts liquid water to vapor, which rises into the atmosphere. Plants contribute through transpiration, releasing water vapor through leaf pores.
Condensation occurs when water vapor cools and forms clouds. Precipitation returns water to Earth’s surface as rain, snow, or other forms.
Surface Runoff carries water (and dissolved nutrients) from land to streams, rivers, and eventually oceans. Infiltration allows water to penetrate soil, where it may become groundwater or remain in soil moisture.
Real-World Connection: Understanding the water cycle helps explain why deforestation can reduce local rainfall – fewer trees mean less transpiration and less local water recycling.
Population Ecology: Understanding How Populations Change
Population Growth Models
Population growth patterns follow predictable mathematical models that help ecologists understand and predict population changes. These models form the foundation for conservation efforts, pest management, and wildlife population assessments.
Exponential Growth occurs when populations face no environmental resistance. Under these ideal conditions, populations grow at a constant percentage rate, producing the characteristic J-shaped curve. The mathematical representation is:
dN/dt = rN
Where N represents population size, t represents time, and r represents the intrinsic rate of increase.
Exponential growth rarely continues indefinitely in nature, but it provides insight into a species’ potential reproductive capacity. You might observe exponential growth when organisms colonize new habitats with abundant resources and few competitors.
Logistic Growth provides a more realistic model for most natural populations. As populations grow, they eventually encounter environmental resistance – limited food, space, or other resources that slow growth rates. This produces an S-shaped (sigmoid) curve with three distinct phases:
- Slow initial growth when population size remains small
- Rapid exponential-like growth during the steepest part of the curve
- Slowing growth as the population approaches carrying capacity
The logistic equation incorporates carrying capacity (K):
dN/dt = rN[(K-N)/K]
Carrying Capacity (K) represents the maximum population size an environment can sustainably support. Populations may temporarily exceed carrying capacity, but this typically leads to population crashes due to resource depletion.

Factors Affecting Population Growth
Population ecologists classify growth-limiting factors into two categories:
Density-Dependent Factors intensify as population density increases. These factors include:
- Competition for limited resources like food, territory, or nesting sites
- Predation pressure that often increases with prey density
- Disease transmission that spreads more easily in crowded populations
- Parasitism that becomes more severe with host density
- Stress from overcrowding that can reduce reproductive success
Density-Independent Factors affect populations regardless of their density:
- Natural disasters like floods, fires, or earthquakes
- Climate events such as droughts or unusual temperature extremes
- Human activities including habitat destruction or pollution
- Seasonal changes that affect resource availability
Study Tip: Remember that density-dependent factors provide negative feedback that helps regulate population size, while density-independent factors can cause unpredictable population fluctuations.
r-Selected vs. K-Selected Species
Species evolve different reproductive strategies based on their environmental conditions and life history constraints. Understanding these strategies helps predict how populations respond to environmental changes.
r-Selected Species prioritize rapid reproduction and population growth. These species typically:
- Reproduce early and frequently
- Produce many offspring with minimal parental care
- Have short generation times
- Tolerate unstable or unpredictable environments
- Examples: bacteria, many insects, annual plants, small mammals like mice
K-Selected Species focus on competitive ability and efficient resource use. These species typically:
- Reproduce later and less frequently
- Produce fewer offspring with extensive parental care
- Have longer generation times
- Thrive in stable, predictable environments
- Examples: large mammals, birds of prey, long-lived trees, humans
Most species exhibit characteristics somewhere between pure r-selection and K-selection, adapting their strategies to specific environmental conditions.
Real-World Connection: Understanding r/K selection helps explain why some species recover quickly from environmental disturbances while others remain vulnerable for decades. Pest insects (r-selected) bounce back rapidly from control efforts, while endangered large mammals (K-selected) recover slowly from population declines.
Community Ecology: How Species Interact
Types of Species Interactions
Community structure emerges from the complex web of interactions between species. These interactions range from mutually beneficial to purely exploitative, shaping community composition and ecosystem dynamics.
Competition occurs when two or more species require the same limited resources. This interaction typically reduces the growth, survival, or reproduction of competing species.
Interspecific Competition happens between different species competing for similar resources. Classic examples include:
- Different bird species competing for the same insect prey
- Plants competing for sunlight in forest understories
- Lions and hyenas competing for large prey animals
Intraspecific Competition occurs within a single species as individuals compete for limited resources. This competition often intensifies as population density increases, serving as a density-dependent limiting factor.
The Competitive Exclusion Principle states that two species with identical ecological requirements cannot coexist indefinitely in the same environment. One species will eventually outcompete and eliminate the other, or the species will evolve to reduce competition through resource partitioning.
Predation involves one organism (predator) consuming another (prey). This interaction drives evolutionary adaptations in both species:
- Predator adaptations: Enhanced sensory systems, efficient hunting strategies, specialized feeding structures
- Prey adaptations: Camouflage, warning coloration, defensive chemicals, behavioral modifications
Herbivory represents a specialized form of predation where animals consume plants. Plants have evolved numerous defenses including:
- Physical defenses: thorns, tough leaves, waxy coatings
- Chemical defenses: toxins, bitter compounds, digestibility reducers
- Mutualistic relationships: partnerships with defensive insects
Parasitism involves one organism (parasite) living on or in another (host), benefiting at the host’s expense. Parasites rarely kill their hosts immediately because this would eliminate their resource base.
Mutualism benefits both participating species. Examples include:
- Pollination: flowers provide nectar while animals transfer pollen
- Mycorrhizal relationships: fungi enhance plant nutrient uptake while receiving carbohydrates
- Cleaning symbioses: cleaner fish remove parasites from larger fish
Commensalism benefits one species while neither helping nor harming the other:
- Birds nesting in trees (birds benefit, trees unaffected)
- Remora fish attached to sharks (remora benefits from transportation, sharks unaffected)

Ecological Niches and Resource Partitioning
An organism’s ecological niche encompasses all the environmental factors and resources it requires for survival, growth, and reproduction. This includes not just physical space, but also:
- Food sources and feeding behavior
- Habitat requirements
- Temperature and moisture tolerance
- Breeding sites and timing
- Interactions with other species
The fundamental niche represents the full range of conditions where a species could potentially survive and reproduce. The realized niche represents the actual conditions where the species exists, typically smaller than the fundamental niche due to competition and other biotic factors.
Resource partitioning allows similar species to coexist by using resources in different ways. Darwin’s finches in the Galápagos Islands provide a classic example:
- Different beak shapes allow specialization on different seed types
- Feeding behavior varies among species (ground vs. cactus vs. tree feeding)
- Breeding timing may differ to reduce competition for nesting sites
Character displacement occurs when competing species evolve different traits that reduce competition. This process can happen through:
- Morphological changes: Different body sizes or feeding structures
- Behavioral changes: Different activity patterns or foraging strategies
- Physiological changes: Different temperature or pH tolerances
Quick Check: How might two species of woodpeckers coexist in the same forest? Consider different tree preferences, feeding heights, insect types, and nesting requirements.
Keystone Species and Community Structure
Some species have disproportionately large effects on community structure relative to their abundance. Understanding these species is crucial for conservation and ecosystem management.
Keystone Species maintain the structure and function of their ecosystems. Their removal causes dramatic changes that cascade through the community. Examples include:
Sea otters in Pacific kelp forests control sea urchin populations. Without otters, urchins overgraze kelp, transforming diverse kelp forests into barren “urchin deserts.”
Wolves in Yellowstone regulate elk populations and behavior. Wolf reintroduction allowed overgrazed vegetation to recover, benefiting numerous other species from songbirds to beavers.
Beavers create and maintain wetland habitats through dam construction. These ecosystem engineers provide habitat for dozens of other species while influencing water flow patterns across landscapes.
Foundation Species physically modify environments, creating habitat for other species:
- Coral reefs provide structure for marine communities
- Large trees create forest canopy habitats
- Oyster reefs filter water while providing surfaces for attachment
Ecosystem Engineers alter their environment through their activities:
- Earthworms modify soil structure and chemistry
- Elephants create clearings and water holes used by other species
- Prairie dogs create underground cities that shelter numerous other species
Succession and Community Change
Primary Succession: Life from Bare Rock
Primary succession occurs in areas where no soil exists, such as newly formed volcanic islands, retreating glaciers, or exposed rock faces. This process demonstrates how life gradually transforms sterile environments into complex ecosystems.
Pioneer Species initiate primary succession. These hardy organisms tolerate extreme conditions and begin the soil formation process:
- Lichens grow directly on rock surfaces, slowly breaking down minerals through chemical weathering
- Mosses trap moisture and organic matter, beginning soil development
- Small herbaceous plants colonize thin soils, adding organic matter through their life cycles
Early Successional Communities develop as soil depth and organic content increase:
- Grasses and herbs dominate due to their rapid growth and efficient resource use
- Small shrubs begin to appear as soil conditions improve
- Fast-growing trees like birches or pines may establish if conditions permit
Late Successional Communities emerge as soil development continues:
- Shade-tolerant species become more common as canopy cover increases
- Slow-growing, long-lived trees gradually dominate the canopy
- Complex understory communities develop in the modified light environment
The climax community represents a relatively stable endpoint where species composition remains fairly constant over time, determined by climate and soil conditions.
Secondary Succession: Recovery After Disturbance
Secondary succession occurs in areas where soil remains intact after disturbance. This process typically proceeds faster than primary succession because established soil provides a foundation for plant growth.
Common triggers for secondary succession include:
- Forest fires that clear vegetation but leave soil and root systems
- Agricultural abandonment where farmland returns to natural vegetation
- Severe storms that create gaps in forest canopies
- Human development followed by abandonment
Old Field Succession provides a classic example of secondary succession:
Year 1-2: Annual weeds dominate, including crabgrass, ragweed, and other fast-growing species that produce abundant seeds.
Years 3-10: Perennial grasses and herbs become established, outcompeting annuals through better root systems and resource storage.
Years 10-25: Shrubs and fast-growing trees like cherries and birches begin to dominate, shading out many herbs and grasses.
Years 25-100: Shade-tolerant trees gradually replace early successional species, developing a closed canopy forest.
100+ years: Late successional species like oaks, maples, or other region-specific climax species dominate the community.

Factors Influencing Succession
Several factors determine the rate and direction of successional change:
Climate sets the ultimate limits on which species can survive in an area. Temperature, precipitation, and seasonal patterns determine whether succession leads toward forest, grassland, or other community types.
Soil Conditions influence which species can establish at each successional stage. Soil chemistry, drainage, and depth affect plant growth and community development.
Seed Dispersal determines which species can colonize disturbed areas. Areas isolated from seed sources may develop differently than those with nearby intact communities.
Herbivory can dramatically alter successional trajectories. Heavy browsing by deer, cattle, or other herbivores may prevent woody species from establishing, maintaining grassland communities indefinitely.
Human Management increasingly influences succession through fire suppression, invasive species introduction, and habitat fragmentation.
Disturbance Frequency affects community composition. Frequent disturbances favor early successional species, while rare disturbances allow late successional species to dominate.
Study Tip: Remember that succession is predictable in general patterns but variable in specific details. Climate and local conditions determine the exact species involved and timeframes required.
Ecosystem Ecology: Energy Flow and Nutrient Cycling
Primary Productivity: The Foundation of Ecosystems
Primary productivity represents the rate at which producers convert solar energy or chemical energy into organic compounds. Understanding productivity patterns helps explain ecosystem structure and carrying capacity.
Gross Primary Productivity (GPP) measures the total energy captured by producers through photosynthesis. However, producers use much of this energy for their own cellular respiration.
Net Primary Productivity (NPP) represents the energy available to consumers after producers meet their own metabolic needs:
NPP = GPP – Plant Respiration
NPP determines how much energy can support herbivore populations and, ultimately, entire food webs.
Factors Limiting Primary Productivity vary among ecosystems:
Terrestrial Ecosystems:
- Temperature affects enzyme function and growing season length
- Water availability limits photosynthesis and nutrient transport
- Nutrient availability, particularly nitrogen and phosphorus
- Light intensity and day length influence photosynthetic rates
Aquatic Ecosystems:
- Light penetration determines the depth of the euphotic zone
- Nutrient availability, especially nitrogen and phosphorus
- Temperature affects metabolic rates and seasonal turnover
- CO₂ availability can limit photosynthesis in some systems
Global Productivity Patterns reflect these limiting factors:
- Tropical rainforests show highest terrestrial productivity due to warm temperatures, abundant rainfall, and year-round growing seasons
- Deserts show low productivity due to water limitation
- Temperate grasslands show moderate productivity with seasonal variation
- Coral reefs and estuaries show highest aquatic productivity due to warm temperatures and nutrient availability
- Open oceans show low productivity due to nutrient limitation despite abundant light and water

Secondary Productivity and Trophic Efficiency
Secondary productivity measures the rate at which consumers convert consumed energy into new biomass. This process involves several efficiency measurements that help ecologists understand energy flow through food webs.
Assimilation Efficiency represents the percentage of consumed energy that gets absorbed rather than excreted:
- Carnivores typically show high assimilation efficiency (80-90%) because animal tissue is easily digestible
- Herbivores show lower efficiency (20-50%) due to indigestible cellulose and lignin in plant tissues
- Detritivores show variable efficiency depending on the decomposition state of their food
Production Efficiency measures the percentage of assimilated energy converted to new biomass rather than lost through respiration:
- Ectothermic animals (cold-blooded) show higher production efficiency because they don’t use energy for temperature regulation
- Endothermic animals (warm-blooded) show lower efficiency due to high metabolic costs of maintaining body temperature
Ecological Efficiency combines consumption, assimilation, and production efficiencies to measure overall energy transfer between trophic levels. This typically ranges from 5-20%, explaining why food chains rarely exceed four or five levels.
Decomposition and Nutrient Cycling
Decomposers play crucial roles in ecosystem function by breaking down dead organic matter and recycling nutrients. Without decomposition, nutrients would remain locked in dead tissue, quickly limiting primary productivity.
Decomposer Organisms include:
Bacteria handle much of the chemical breakdown of organic compounds, especially in aquatic environments and anaerobic conditions.
Fungi excel at breaking down complex organic compounds like cellulose and lignin, dominating decomposition in terrestrial ecosystems.
Detritivores physically fragment dead material, increasing surface area for bacterial and fungal attack. Examples include earthworms, millipedes, and many soil insects.
Factors Affecting Decomposition Rates:
Temperature influences enzyme activity and microbial metabolism. Warm temperatures accelerate decomposition, while cold temperatures slow it dramatically.
Moisture affects microbial activity and chemical reactions. Both drought and waterlogging can slow decomposition, though for different reasons.
Oxygen Availability determines whether aerobic or anaerobic decomposition occurs. Aerobic decomposition proceeds much faster and more completely.
Chemical Composition of dead material affects decomposition rates:
- High C:N ratios (like wood) decompose slowly because nitrogen limits microbial growth
- Low C:N ratios (like animal tissue) decompose rapidly
- Lignin content slows decomposition because few organisms can break down this complex compound
pH influences microbial communities and enzyme function. Most decomposers prefer neutral to slightly acidic conditions.
Common Mistake Alert: Students often think decomposition simply “uses up” organic matter. In reality, decomposition transforms complex organic compounds into simpler inorganic nutrients that plants can reuse, making it essential for ecosystem sustainability.
Human Impact on Ecosystems
Habitat Destruction and Fragmentation
Human activities have modified more than 75% of Earth’s land surface, making habitat destruction the leading cause of biodiversity loss. Understanding these impacts helps develop effective conservation strategies.
Deforestation affects both terrestrial and global systems:
- Direct effects: Loss of habitat for forest species, reduced carbon storage, altered water cycles
- Indirect effects: Climate change, soil erosion, downstream flooding
- Edge effects: Forest fragments experience different conditions than intact forests, affecting species composition
Urbanization creates novel ecosystems while eliminating natural habitats:
- Habitat loss: Direct replacement of natural areas with built environments
- Pollution: Air, water, and noise pollution affecting nearby natural areas
- Altered hydrology: Impervious surfaces increase runoff and reduce groundwater recharge
- Light pollution: Artificial lighting disrupts natural circadian rhythms and migration patterns
Agricultural Expansion simplifies natural ecosystems:
- Monoculture farming: Replaces diverse natural communities with single-species crops
- Pesticide use: Affects non-target species and food web structure
- Fertilizer runoff: Causes eutrophication in aquatic systems
- Soil degradation: Intensive farming can lead to erosion and nutrient depletion
Habitat Fragmentation creates isolated patches of natural habitat surrounded by modified landscapes:
- Edge effects: Fragment edges experience different microclimates than interiors
- Population isolation: Small, isolated populations face increased extinction risk
- Reduced gene flow: Limited movement between fragments reduces genetic diversity
- Species-area relationships: Smaller habitat patches support fewer species
Climate Change and Ecosystem Responses
Anthropogenic climate change represents a global-scale ecological experiment affecting every ecosystem on Earth. Understanding these impacts requires knowledge of both direct and indirect effects.
Direct Temperature Effects:
- Species range shifts: Many species are moving toward poles or higher elevations as temperatures warm
- Phenological changes: Timing of biological events (flowering, migration, breeding) is shifting
- Coral bleaching: Rising ocean temperatures cause corals to expel symbiotic algae
- Ice ecosystem loss: Arctic and alpine ecosystems face habitat reduction
Precipitation Changes:
- Drought stress: Reduced rainfall affects plant productivity and animal survival
- Flooding: Increased precipitation intensity can damage ecosystems and disrupt communities
- Seasonal shifts: Changes in precipitation timing affect species interactions and reproduction
Ocean Chemistry Changes:
- Ocean acidification: Increased CO₂ absorption lowers ocean pH, affecting calcifying organisms
- Thermal stratification: Warmer surface waters reduce nutrient mixing in oceans
- Sea level rise: Coastal ecosystems face submersion and saltwater intrusion
Ecosystem-Level Responses:
- Community composition changes: Species with different temperature tolerances replace existing species
- Trophic mismatches: Predators and prey may respond differently to climate changes
- Ecosystem service disruption: Pollination, water purification, and other services may decline
- Threshold effects: Some ecosystems may undergo rapid, irreversible changes at critical temperature thresholds
Invasive Species and Biological Invasions
Invasive species represent one of the most significant threats to native biodiversity, with impacts that can restructure entire ecosystems. Understanding invasion biology helps predict and prevent ecological damage.
Characteristics of Successful Invaders:
- High reproductive rates: Rapid population growth allows quick establishment
- Broad environmental tolerance: Ability to survive in various conditions
- Efficient dispersal: Effective mechanisms for reaching new areas
- Lack of natural enemies: Freedom from predators, parasites, and diseases in new environments
- Competitive ability: Success in competing with native species for resources
Invasion Process:
Introduction: Species arrive in new areas through human activities (intentional or accidental transport)
Establishment: Small populations successfully reproduce and persist in new environments
Spread: Populations expand geographically and increase in abundance
Impact: Established invasive species begin affecting native ecosystems
Classic Examples:
Zebra Mussels in the Great Lakes filter enormous volumes of water, removing plankton that native fish depend on while fouling human infrastructure.
Kudzu in the southeastern United States grows rapidly over native vegetation, blocking sunlight and eventually killing trees and shrubs.
Cane Toads in Australia poison native predators that attempt to eat them, lacking experience with the toads’ toxic skin secretions.
European Starlings in North America compete aggressively with native cavity-nesting birds for nesting sites.
Real-World Connection: Many invasive species were originally introduced for beneficial purposes. House sparrows were brought to North America to control insects, while purple loosestrife was planted as an ornamental garden flower. These examples highlight the difficulty of predicting ecological impacts.
Pollution and Ecosystem Health
Pollution affects ecosystems through multiple pathways, from direct toxicity to subtle disruptions of ecological processes. Understanding these impacts helps develop effective environmental policies.
Eutrophication occurs when excess nutrients (especially nitrogen and phosphorus) enter aquatic systems:
Sources: Agricultural runoff, sewage discharge, atmospheric deposition from fossil fuel combustion
Process: Excess nutrients stimulate algae and plant growth, leading to algal blooms. When these organisms die and decompose, oxygen depletion occurs.
Effects: Fish kills, loss of aquatic biodiversity, creation of “dead zones” where few organisms can survive
Acid Precipitation results from air pollution that lowers the pH of rainfall:
Sources: Sulfur dioxide and nitrogen oxides from fossil fuel combustion
Effects:
- Forest ecosystems: Soil acidification, nutrient leaching, direct leaf damage
- Aquatic ecosystems: Water acidification, aluminum toxicity, loss of sensitive species
Bioaccumulation and Biomagnification:
Bioaccumulation: Individual organisms accumulate pollutants from their environment faster than they can eliminate them
Biomagnification: Pollutant concentrations increase at higher trophic levels as predators consume multiple contaminated prey
Classic Example: DDT accumulation in bird populations led to eggshell thinning and population crashes in raptors and other birds
Endocrine Disruptors: Chemicals that interfere with hormone systems, affecting reproduction and development even at very low concentrations
Conservation Biology and Ecosystem Management
Biodiversity and Conservation Strategies
Biodiversity conservation requires understanding patterns of species richness, endemism, and ecosystem function. Effective conservation strategies must address multiple scales and types of diversity.
Levels of Biodiversity:
Genetic Diversity within species provides the raw material for adaptation to environmental change. Small, isolated populations lose genetic diversity through inbreeding and genetic drift.
Species Diversity includes both the number of species (richness) and their relative abundances (evenness). High diversity generally correlates with ecosystem stability and resilience.
Ecosystem Diversity encompasses the variety of habitat types and ecological processes across landscapes. Different ecosystems provide different services and support different species.
Conservation Approaches:
Protected Areas preserve critical habitats and ecosystems:
- National parks and wildlife refuges protect large, intact ecosystems
- Marine protected areas safeguard ocean biodiversity and fisheries
- Corridor connections link isolated protected areas to allow species movement
Species-Specific Conservation focuses on individual threatened species:
- Captive breeding programs maintain genetic diversity while populations recover
- Habitat restoration recreates conditions needed for species survival
- Reintroduction programs establish new populations in suitable habitats
Ecosystem-Based Management considers entire ecosystems rather than individual species:
- Watershed management protects water quality and aquatic ecosystems
- Sustainable forestry maintains forest ecosystems while allowing resource use
- Integrated pest management reduces pesticide use while controlling agricultural pests
Community-Based Conservation involves local people in conservation efforts:
- Ecotourism provides economic incentives for habitat protection
- Sustainable resource use allows local communities to benefit from conservation
- Education programs build support for conservation among local populations
Restoration Ecology
Restoration ecology applies ecological principles to repair damaged ecosystems. This field has grown rapidly as the need to address human environmental impacts has become more urgent.
Restoration Goals vary depending on ecosystem type and damage extent:
Primary Restoration aims to return ecosystems to pre-disturbance conditions, including original species composition and ecological processes.
Rehabilitation seeks to repair ecosystem function without necessarily recreating original species composition.
Enhancement improves degraded ecosystems by adding beneficial features or removing harmful elements.
Restoration Techniques:
Soil Restoration addresses physical and chemical damage:
- Erosion control stabilizes soil and prevents further loss
- Organic matter addition improves soil structure and fertility
- pH adjustment corrects acidification or alkalinization
- Contaminant removal eliminates toxic substances
Hydrological Restoration repairs water flow patterns:
- Wetland restoration recreates natural flooding cycles and water levels
- Stream channel restoration removes artificial modifications and restores natural flow
- Dam removal allows natural river processes to resume
Biological Restoration reestablishes native species and communities:
- Seed collection and propagation produces native plants for restoration
- Invasive species removal eliminates competitors and creates space for natives
- Wildlife reintroduction restores missing ecosystem components
Restoration Challenges:
- Time lags: Ecosystem recovery often takes decades or centuries
- Dispersal limitations: Desired species may be unable to reach restoration sites
- Novel ecosystems: Some damaged areas cannot return to original conditions
- Climate change: Shifting conditions may make historical restoration targets inappropriate
Study Tip: Successful restoration requires understanding both the ecosystem’s original condition and the factors that caused degradation. Simply planting native species without addressing underlying problems rarely succeeds.
Practice Questions and Exam Preparation
Multiple Choice Questions
Question 1: In a grassland ecosystem, grasshoppers consume grass, birds consume grasshoppers, and hawks consume birds. If the grass contains 10,000 kcal of energy, approximately how much energy is available to the hawk population?
A) 1,000 kcal
B) 100 kcal
C) 10 kcal
D) 1 kcal
E) 0.1 kcal
Answer: C) 10 kcal
Explanation: Using the 10% rule, energy transfers with only 10% efficiency between trophic levels. Grass (producers) → Grasshoppers (primary consumers): 10,000 × 0.1 = 1,000 kcal → Birds (secondary consumers): 1,000 × 0.1 = 100 kcal → Hawks (tertiary consumers): 100 × 0.1 = 10 kcal.
Question 2: Which of the following best explains why phosphorus is often a limiting nutrient in freshwater ecosystems?
A) Phosphorus is required in larger quantities than other nutrients
B) Phosphorus cannot be recycled through decomposition
C) Phosphorus has no significant atmospheric reservoir
D) Phosphorus is toxic to most aquatic organisms
E) Phosphorus only occurs in igneous rocks
Answer: C) Phosphorus has no significant atmospheric reservoir
Explanation: Unlike nitrogen and carbon, phosphorus lacks a gaseous phase under normal conditions, so it has no atmospheric reservoir. This makes phosphorus cycling entirely dependent on geological processes and biological recycling, often making it the limiting nutrient in freshwater systems.
Question 3: Two species of birds feed on insects in the same forest. Species A feeds primarily on insects found on tree bark, while Species B feeds primarily on insects found on leaves. This is an example of:
A) Competitive exclusion
B) Resource partitioning
C) Character displacement
D) Predator-prey coevolution
E) Mutualism
Answer: B) Resource partitioning
Explanation: Resource partitioning allows potentially competing species to coexist by using different parts of the same resource (in this case, insects from different microhabitats). This reduces interspecific competition and allows both species to coexist.
Question 4: Which of the following characteristics would make a species most likely to be successful as an invasive species?
A) Highly specialized diet and specific habitat requirements
B) Low reproductive rate and long generation time
C) High dispersal ability and broad environmental tolerance
D) Complex social structure and extensive parental care
E) Narrow geographic distribution and low genetic diversity
Answer: C) High dispersal ability and broad environmental tolerance
Explanation: Successful invasive species typically have traits that allow them to establish and spread in new environments: high dispersal ability helps them reach new areas, while broad environmental tolerance allows them to survive in various conditions.
Question 5: In primary succession, pioneer species such as lichens are important because they:
A) Prevent other species from colonizing the area
B) Provide food for herbivorous animals
C) Begin the process of soil formation
D) Create shade for later successional species
E) Fix atmospheric nitrogen
Answer: C) Begin the process of soil formation
Explanation: Pioneer species like lichens begin primary succession by growing on bare rock and gradually breaking it down through chemical and physical weathering, creating the first soil that other species can use.
Free Response Questions
Question 1: A research team studied energy flow in a temperate forest ecosystem. They measured the following annual energy values:
- Gross Primary Productivity (GPP): 20,000 kcal/m²
- Plant Respiration: 12,000 kcal/m²
- Primary Consumer Biomass Production: 800 kcal/m²
- Secondary Consumer Biomass Production: 80 kcal/m²
(a) Calculate the Net Primary Productivity (NPP) for this ecosystem. Show your work and explain what NPP represents.
(b) Calculate the ecological efficiency of energy transfer from primary producers to primary consumers. Show your work and explain whether this value is typical for natural ecosystems.
(c) Explain two factors that could cause the GPP to increase in this forest ecosystem and describe the mechanism by which each factor would affect primary productivity.
(d) Predict how a severe drought would affect each of the measured energy values and justify your predictions based on ecological principles.
Sample Answer:
(a) NPP = GPP – Plant Respiration
NPP = 20,000 – 12,000 = 8,000 kcal/m²
NPP represents the net energy available to consumers after producers have used energy for their own metabolic needs through cellular respiration. This is the energy that can support all other trophic levels in the ecosystem.
(b) Ecological Efficiency = (Primary Consumer Production / NPP) × 100
Ecological Efficiency = (800 / 8,000) × 100 = 10%
This value is typical for natural ecosystems. The 10% rule states that approximately 10% of energy transfers between trophic levels, with the remaining 90% lost through metabolic processes, heat production, and incomplete consumption.
(c) Two factors that could increase GPP:
Increased atmospheric CO₂ concentration: Higher CO₂ levels can enhance photosynthetic rates through the CO₂ fertilization effect, allowing plants to capture more energy from sunlight.
Increased nutrient availability: Addition of limiting nutrients like nitrogen or phosphorus would allow plants to increase their photosynthetic capacity and growth rates, capturing more solar energy.
(d) During severe drought:
GPP would decrease: Water stress would reduce photosynthetic rates as plants close stomata to conserve water, limiting CO₂ uptake.
Plant Respiration would initially increase then decrease: Stress responses initially increase metabolic activity, but severe water stress eventually reduces all metabolic processes.
Primary Consumer Production would decrease: Reduced plant productivity provides less food for herbivores, and drought stress directly affects animal physiology.
Secondary Consumer Production would decrease: Reduced prey availability and indirect effects of drought on the entire food web would limit secondary consumer growth.
Data Analysis Questions
Question 2: The graph below shows atmospheric CO₂ concentrations measured at Mauna Loa Observatory from 1958 to 2020.
[INSERT GRAPH: CO₂ concentration over time showing seasonal fluctuations and overall increasing trend from ~315 ppm in 1958 to ~415 ppm in 2020]
(a) Describe the overall trend in atmospheric CO₂ concentration shown in the graph.
(b) Explain the cause of the seasonal fluctuations visible in the data.
(c) Calculate the average rate of CO₂ increase per decade from 1958 to 2020.
(d) Predict three ecological consequences of this CO₂ increase and explain the mechanisms behind each consequence.
Sample Answer:
(a) The graph shows a steady increase in atmospheric CO₂ concentration from approximately 315 ppm in 1958 to about 415 ppm in 2020, representing an increase of about 100 ppm over 62 years. The increase appears to be accelerating slightly over time.
(b) The seasonal fluctuations result from the Northern Hemisphere’s vegetation cycle. During spring and summer, plants photosynthesize actively, removing CO₂ from the atmosphere and causing concentrations to decrease. During fall and winter, reduced photosynthesis and increased decomposition cause CO₂ concentrations to increase.
(c) Total increase: 415 – 315 = 100 ppm over 62 years
Rate per decade: (100 ppm / 62 years) × 10 years = 16.1 ppm per decade
(d) Three ecological consequences:
Ocean acidification: Increased atmospheric CO₂ dissolves in seawater, forming carbonic acid and lowering ocean pH. This affects calcifying organisms like corals and shellfish by making it harder to build calcium carbonate structures.
Enhanced plant growth in some ecosystems: Higher CO₂ concentrations can increase photosynthetic rates in C3 plants through the CO₂ fertilization effect, potentially increasing primary productivity in ecosystems where other factors (water, nutrients) are not limiting.
Climate change effects on species distributions: Rising CO₂ contributes to global warming, causing species to shift their ranges toward poles or higher elevations as they track suitable temperature conditions.
Study Strategies and Exam Tips
Memory Techniques
Energy Flow Mnemonics:
- “Please Call Primary Consumers Tasty” for trophic levels: Producers, Primary Consumers, Secondary Consumers, Tertiary Consumers
- “Ten Percent Goes Up” to remember the 10% energy transfer rule
Biogeochemical Cycle Memory:
- Carbon: “Plants Take, Animals Release” (photosynthesis takes CO₂, respiration releases it)
- Nitrogen: “Fix, Nitrify, Assimilate, Decompose, Denitrify” for cycle steps
- Phosphorus: “No Air, Just Rocks” (no atmospheric component)
Succession Memory:
- Primary: “Lichens First, Soil Last” (bare rock to soil formation)
- Secondary: “Weeds to Trees” (disturbed soil to forest)
Common Exam Mistakes
Energy Flow Errors:
- Confusing energy flow (one-directional) with nutrient cycling (cyclical)
- Forgetting that energy decreases at each trophic level
- Miscalculating energy transfer using incorrect percentages
Population Growth Mistakes:
- Confusing exponential and logistic growth patterns
- Forgetting that carrying capacity can change
- Misunderstanding r-selected vs. K-selected characteristics
Species Interaction Confusion:
- Mixing up mutualism, commensalism, and parasitism effects
- Forgetting that competition reduces both species’ fitness
- Misunderstanding predator-prey cycles
Human Impact Oversimplification:
- Assuming all human impacts are negative
- Forgetting indirect effects of human activities
- Misunderstanding climate change mechanisms
High-Yield Topics for AP Exam
Based on past AP Biology exams, focus extra attention on these frequently tested topics:
Energy and Matter (appears on every exam):
- 10% rule calculations
- Trophic level identification
- Primary productivity factors
Population Dynamics (common FRQ topic):
- Exponential vs. logistic growth
- Density-dependent vs. density-independent factors
- r-selected vs. K-selected species
Species Interactions (frequent multiple choice):
- Competition and resource partitioning
- Predator-prey relationships
- Mutualism examples
Biogeochemical Cycles (often combined with other topics):
- Carbon cycle and climate change
- Nitrogen cycle limitations
- Phosphorus as limiting nutrient
Human Impact (increasing emphasis):
- Climate change effects
- Invasive species characteristics
- Conservation strategies
Remember that ecology connects to every other AP Biology unit. Use your knowledge of cellular processes, genetics, and evolution to explain ecological phenomena. The most successful students understand these connections and can apply biological principles across different scales, from molecules to ecosystems.
Good luck with your AP Biology exam! Remember that understanding ecology helps you make sense of the natural world around you – knowledge you’ll use long after the test is over.
Key Takeaways for Unit 8 Success:
✅ Master energy flow calculations and the 10% rule
✅ Understand how biogeochemical cycles connect to climate change
✅ Distinguish between different types of species interactions
✅ Connect population growth models to real-world examples
✅ Recognize human impacts and conservation solutions
✅ Practice data analysis and graph interpretation
✅ Use specific examples to support your explanations
✅ Connect ecology concepts to other AP Biology units
Your journey through AP Biology Unit 8 equips you with essential knowledge for understanding environmental challenges and solutions. These concepts form the foundation for careers in conservation, environmental science, and sustainability – fields that will shape our planet’s future.
What do you think about this topic? Share your doubts in the comments.
Recommended –
2 thoughts on “Mastering AP Biology Unit 8: Ecology – Your Complete Guide to Acing 15% of the AP Exam”