
The Living World Around You
Have you ever wondered why a forest feels cooler than a parking lot on a hot summer day? Or why certain fish species disappear when a river becomes polluted? The answer lies in understanding ecosystems – the intricate web of relationships between living organisms and their physical environment that surrounds us every day.
When you step into your school garden, you’re entering a miniature ecosystem where plants photosynthesize using sunlight, insects pollinate flowers, bacteria decompose fallen leaves, and nutrients cycle through soil, plants, and back again. This same principle operates whether you’re looking at a small pond, a vast grassland, or even the entire Earth – they’re all ecosystems functioning through the same fundamental processes.
Chapter 12 of your CBSE Class 12 Biology curriculum takes you deep into these fascinating ecological interactions. You’ll discover how energy flows through living systems, how nutrients cycle endlessly through biotic and abiotic components, and how human activities impact these delicate balances. This knowledge isn’t just academic – it’s essential for understanding climate change, conservation efforts, sustainable agriculture, and even career opportunities in environmental science and biotechnology.
Learning Objectives
By the end of this comprehensive study guide, you will be able to:
- Analyze ecosystem structure and distinguish between biotic and abiotic components with real-world examples
- Trace energy flow through trophic levels and explain why energy transfer is unidirectional
- Calculate productivity at different trophic levels and understand factors affecting primary and secondary productivity
- Describe decomposition processes and identify factors influencing decomposition rates
- Construct and interpret ecological pyramids of number, biomass, and energy
- Explain nutrient cycling with detailed analysis of carbon and phosphorus cycles
- Apply ecological principles to solve complex problems related to ecosystem management
- Connect ecosystem concepts to current environmental challenges and biotechnological applications
1. Ecosystem Fundamentals: Building Blocks of Life
What Makes an Ecosystem?
Think of an ecosystem as nature’s version of a bustling city. Just as a city has residents (people), infrastructure (buildings, roads), and services (transportation, utilities), an ecosystem has biotic components (living organisms), abiotic components (physical factors), and processes (energy flow, nutrient cycling) that keep everything functioning.
Biotic Components include all living organisms, which we categorize based on how they obtain energy:
- Producers (Autotrophs): These are the “manufacturers” of the ecosystem – primarily green plants, algae, and some bacteria that convert sunlight into chemical energy through photosynthesis. In aquatic ecosystems, phytoplankton play this crucial role.
- Primary Consumers (Herbivores): The “primary customers” who feed directly on producers. Examples include grasshoppers in grasslands, zooplankton in aquatic systems, and deer in forests.
- Secondary Consumers (Primary Carnivores): These organisms feed on primary consumers. Think of frogs eating insects or small fish consuming zooplankton.
- Tertiary Consumers (Secondary Carnivores): Top predators like hawks, large fish, or tigers that feed on secondary consumers.
- Decomposers (Saprophytes): The “recycling crew” consisting of bacteria and fungi that break down dead organic matter, returning nutrients to the ecosystem.
Abiotic Components provide the physical and chemical framework:
- Physical factors: Temperature, light, humidity, wind, soil texture
- Chemical factors: pH, oxygen levels, carbon dioxide concentration, mineral nutrients
- Climatic factors: Rainfall patterns, seasonal variations, atmospheric pressure
Biology Check: Can you identify the trophic level of humans in different situations? When eating vegetables, we’re primary consumers. When eating chicken (which eats grains), we’re secondary consumers. This flexibility is why humans are called omnivores!
Ecosystem Types and Characteristics
Ecosystems vary dramatically in size and complexity. A microecosystem might be a drop of pond water teeming with microorganisms, while a biome like the Amazon rainforest represents a massive ecosystem covering millions of square kilometers.
Terrestrial ecosystems include forests, grasslands, and deserts, each adapted to specific climate conditions. Aquatic ecosystems encompass freshwater systems (lakes, rivers, ponds) and marine systems (oceans, coral reefs, estuaries).
Real-World Biology: The Western Ghats of India represent one of the world’s biodiversity hotspots, containing multiple ecosystem types from tropical rainforests at lower elevations to grasslands at higher altitudes. This ecosystem diversity supports over 4,000 plant species and numerous endemic animals.
2. Energy Flow: The One-Way Street of Life
Understanding Energy Dynamics in Ecosystems
Energy flow in ecosystems follows the fundamental laws of thermodynamics. Unlike nutrients, which cycle continuously, energy flows in one direction – from the sun through producers to various consumer levels, eventually being lost as heat to the environment.
PROCESS: Photosynthesis – The Energy Gateway: Solar energy (about 1.4 × 10²¹ calories per year reaches Earth) is captured by chlorophyll molecules in producer organisms. Only about 1-2% of incident solar energy is actually converted to chemical energy through photosynthesis, but this small percentage powers virtually all life on Earth.
Trophic Levels and Energy Transfer
Imagine energy flow as a river flowing downhill – it always moves in one direction and loses “water” (energy) at each step due to evaporation (metabolic processes).
Energy Transfer Efficiency follows the 10% Rule: On average, only about 10% of energy from one trophic level is transferred to the next level. The remaining 90% is:
- Used for metabolic processes (respiration, movement, reproduction)
- Lost as heat during cellular respiration
- Not consumed (remains in uneaten biomass)
- Not assimilated (passed through digestive system)
Let’s trace energy through a grassland ecosystem:
- Producers (Grass): Capture 10,000 kcal of solar energy
- Primary Consumers (Grasshoppers): Receive ~1,000 kcal (10% of grass energy)
- Secondary Consumers (Frogs): Receive ~100 kcal (10% of grasshopper energy)
- Tertiary Consumers (Snakes): Receive ~10 kcal (10% of frog energy)
This explains why food chains rarely exceed 4-5 trophic levels – there simply isn’t enough energy to support higher levels efficiently.
Common Error Alert: Students often confuse energy flow with nutrient cycling. Remember: Energy flows one way (sun → producers → consumers → heat), while nutrients cycle continuously (soil → plants → animals → decomposers → soil).
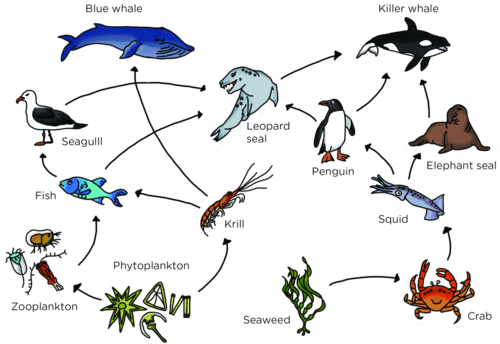
Food Chains, Food Webs, and Trophic Structure
A food chain represents a linear sequence of energy transfer, while a food web shows the complex, interconnected feeding relationships in real ecosystems. Most ecosystems have intricate food webs rather than simple chains.
Grazing Food Chain starts with living producers:
Grass → Rabbit → Fox → Decomposers
Detritus Food Chain begins with dead organic matter:
Dead leaves → Bacteria → Protozoa → Small invertebrates
In most ecosystems, the detritus food chain processes more energy than the grazing food chain, especially in forest ecosystems where much organic matter falls to the ground as leaf litter.
3. Productivity: Measuring Ecosystem Efficiency
Primary Productivity – The Foundation
Primary productivity measures the rate at which producers convert solar energy into chemical energy. Think of it as the “income” of an ecosystem.
Gross Primary Productivity (GPP): Total energy captured by producers through photosynthesis per unit area per unit time. This represents the maximum potential energy available to an ecosystem.
Net Primary Productivity (NPP): Energy remaining after producers use some for their own respiration. This is the actual energy available to herbivores.
Formula: NPP = GPP – R (where R = respiration by producers)
Factors Affecting Primary Productivity
Environmental Factors:
- Light intensity: Directly affects photosynthesis rate
- Temperature: Influences enzyme activity in photosynthesis
- Water availability: Essential for photosynthesis and plant growth
- Nutrient availability: Especially nitrogen and phosphorus
Plant Factors:
- Leaf area index: More leaf surface = more photosynthesis
- Chlorophyll concentration: Higher concentration = better light capture
- Plant species: Different species have varying photosynthetic efficiencies
Real-World Biology: Tropical rainforests have the highest terrestrial primary productivity (2000-2500 g/m²/year) due to optimal temperature, abundant rainfall, and year-round growing seasons. In contrast, deserts have very low productivity (10-250 g/m²/year) due to water limitations.
Secondary Productivity
Secondary productivity measures the rate of biomass production by heterotrophs (consumers). It depends entirely on primary productivity and energy transfer efficiency.
Factors Affecting Secondary Productivity:
- Available food (primary productivity)
- Conversion efficiency of consumers
- Environmental temperature (affects metabolic rates)
- Population dynamics and competition
Biology Check: If a grassland has NPP of 2000 g/m²/year and energy transfer efficiency is 10%, what would be the secondary productivity of herbivores? Answer: 200 g/m²/year.
4. Decomposition: Nature’s Recycling System
The Decomposition Process
Decomposition is the breakdown of dead organic matter by decomposer organisms, releasing nutrients back into the ecosystem. Without decomposition, nutrients would remain locked in dead organisms, and ecosystems would collapse.
PROCESS: Decomposition Stages: 1) Fragmentation – physical breakdown into smaller pieces, 2) Leaching – water-soluble nutrients dissolve and move into soil, 3) Catabolism – enzymatic breakdown of complex molecules, 4) Humification – formation of humus (dark, nutrient-rich organic matter), 5) Mineralization – release of inorganic nutrients
Factors Affecting Decomposition Rate
Chemical Composition of Detritus:
- Nitrogen content: Higher nitrogen = faster decomposition
- Lignin content: High lignin (like in woody material) = slower decomposition
- Sugar content: Simple sugars decompose rapidly
Environmental Factors:
- Temperature: Higher temperature = increased enzyme activity = faster decomposition
- Moisture: Adequate water needed for microbial activity
- Oxygen availability: Aerobic decomposition is much faster than anaerobic
- pH: Most decomposers prefer slightly acidic to neutral conditions
Real-World Biology: In tropical rainforests, leaf litter decomposes completely within 6-8 weeks due to high temperature and humidity. In cold, dry environments like tundra, organic matter may take decades to decompose fully.
Process Analysis: Why does waterlogged soil slow decomposition? Limited oxygen availability forces decomposers to use anaerobic respiration, which is much less efficient than aerobic respiration, significantly slowing the breakdown process.
5. Ecological Pyramids: Visualizing Ecosystem Structure
Types of Ecological Pyramids
Ecological pyramids provide visual representations of trophic structure and energy flow. Think of them as “snapshots” of ecosystem organization at any given time.
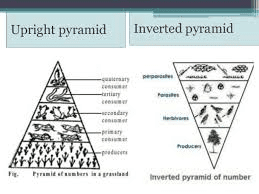
Pyramid of Numbers
Shows the number of individual organisms at each trophic level.
Upright Pyramid: Common in grassland ecosystems
- Producers (grass): Millions of individual plants
- Primary consumers (insects): Thousands of individuals
- Secondary consumers (birds): Hundreds of individuals
- Tertiary consumers (hawks): Few individuals
Inverted Pyramid: Found in forest ecosystems
- Producers (trees): Few large individuals
- Primary consumers (insects): Many individuals feeding on leaves
- This inversion occurs because one large tree can support many herbivores
Pyramid of Biomass
Represents the total dry weight of organisms at each trophic level at a specific time.
Terrestrial ecosystems typically show upright pyramids:
- Biomass decreases from producers to top consumers
- Reflects the 10% energy transfer efficiency
Aquatic ecosystems may show inverted pyramids:
- Phytoplankton (producers) have less biomass than zooplankton (consumers) at any instant
- This occurs because phytoplankton reproduce rapidly but are quickly consumed
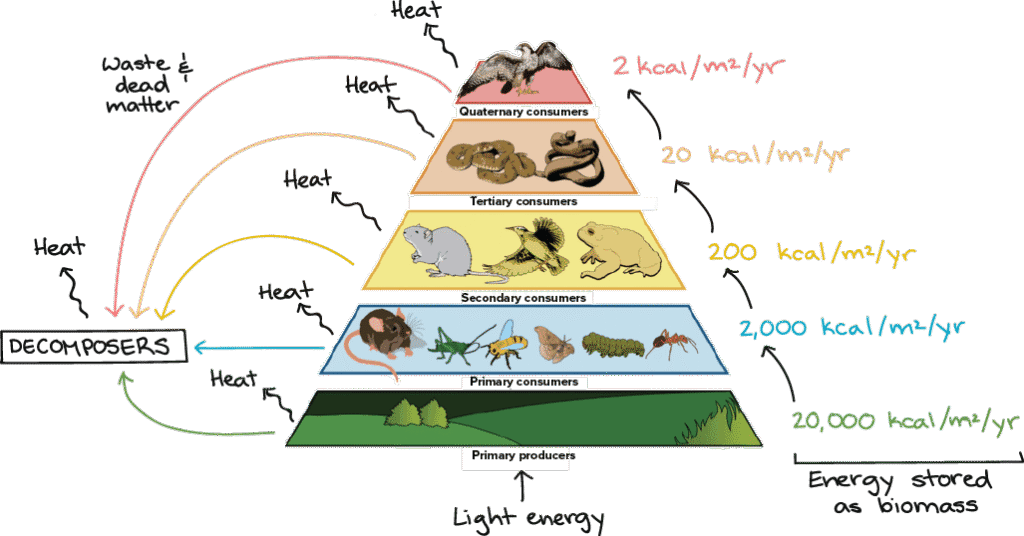
Pyramid of Energy
Always forms an upright pyramid because energy flow follows thermodynamic laws. Energy decreases at each successive trophic level due to metabolic losses.
Key Features:
- Never inverted (unlike number and biomass pyramids)
- Shows rate of energy flow (energy per unit area per unit time)
- Best represents ecosystem functioning
Common Error Alert: Students often confuse biomass pyramids with energy pyramids. Remember: Biomass can be inverted in aquatic systems, but energy pyramids are always upright due to energy loss at each level.
6. Nutrient Cycling: The Circle of Life
Carbon Cycle – The Global Connector
Carbon cycling connects all ecosystems globally and is crucial for understanding climate change.
PROCESS: Carbon Cycle Detailed Mechanism: 1) Atmospheric CO₂ fixation by producers through photosynthesis (6CO₂ + 6H₂O + sunlight → C₆H₁₂O₆ + 6O₂), 2) Carbon incorporation into biomass through various biosynthetic pathways, 3) Release back to atmosphere through respiration by all organisms, 4) Long-term storage in fossil fuels, limestone, and ocean sediments, 5) Human activities releasing stored carbon through combustion
Major Carbon Reservoirs:
- Atmosphere: ~750 billion tons as CO₂
- Oceans: ~38,000 billion tons (dissolved CO₂ and carbonates)
- Terrestrial biomass: ~2,000 billion tons
- Fossil fuels: ~4,000 billion tons
Carbon Fluxes:
- Photosynthesis: Removes ~120 billion tons CO₂/year from atmosphere
- Respiration: Returns ~120 billion tons CO₂/year to atmosphere
- Human activities: Add ~8 billion tons CO₂/year (burning fossil fuels, deforestation)
Phosphorus Cycle – The Limiting Factor
Unlike carbon, phosphorus has no significant atmospheric component, making it often the limiting nutrient in ecosystems.
PROCESS: Phosphorus Cycle Mechanism: 1) Weathering of phosphate rocks releases phosphate ions (PO₄³⁻) into soil, 2) Plants absorb phosphates through root systems, 3) Consumers obtain phosphorus by eating producers, 4) Decomposers release phosphates from dead organisms back to soil, 5) Some phosphorus lost to sediments in water bodies, 6) Geological uplift eventually returns sedimentary phosphorus to terrestrial systems
Key Features:
- No gaseous phase under normal conditions
- Slow cycling compared to carbon and nitrogen
- Often limiting for plant growth
- Human impact through mining and fertilizer use significantly alters natural cycle
Real-World Biology: Agricultural runoff containing excess phosphorus causes eutrophication in water bodies. Algae multiply rapidly, consume oxygen during decomposition, and create “dead zones” where other organisms cannot survive.
7. Ecosystem Services and Human Impact
Ecosystem Services Classification
Ecosystems provide numerous services essential for human survival and well-being:
Provisioning Services:
- Food production (crops, fish, wild game)
- Fresh water supply
- Timber and fiber materials
- Genetic resources for medicine and biotechnology
Regulating Services:
- Climate regulation through carbon sequestration
- Water purification and flood control
- Disease control by predators
- Pollination of crops
Supporting Services:
- Nutrient cycling
- Primary productivity
- Oxygen production
- Habitat provision
Cultural Services:
- Recreation and tourism
- Spiritual and aesthetic values
- Educational opportunities
- Cultural heritage preservation
Human Impacts on Ecosystems
Direct Impacts:
- Habitat destruction: Deforestation, urbanization, mining
- Pollution: Chemical contamants, plastic waste, noise pollution
- Overexploitation: Overfishing, excessive hunting, unsustainable harvesting
- Species introduction: Invasive species disrupting native ecosystems
Indirect Impacts:
- Climate change: Altering temperature and precipitation patterns
- Atmospheric changes: Ozone depletion, acid rain
- Global nitrogen cycle disruption: Excessive fertilizer use
- Fragmentation: Breaking large ecosystems into smaller patches
Current Research: Scientists are developing “ecosystem accounting” methods to assign economic values to ecosystem services. For example, a single large tree provides approximately $625 worth of services annually through air purification, carbon storage, and climate regulation.
8. Problem-Solving Strategies for Ecosystem Analysis
Systematic Approach to Ecosystem Problems
When faced with complex ecosystem questions, follow this analytical framework:
- Identify the ecosystem type and its major components
- Determine the process involved (energy flow, nutrient cycling, productivity)
- Analyze cause-and-effect relationships between biotic and abiotic factors
- Apply relevant ecological principles (10% rule, limiting factors, etc.)
- Consider human impacts and management implications
- Draw conclusions with proper ecological reasoning
Energy Flow Calculations
Example Problem: In a forest ecosystem, trees capture 20,000 kcal/m²/year. If herbivores have 15% efficiency and carnivores have 12% efficiency, calculate energy available at each level.
Solution:
- Primary producers: 20,000 kcal/m²/year
- Primary consumers: 20,000 × 0.15 = 3,000 kcal/m²/year
- Secondary consumers: 3,000 × 0.12 = 360 kcal/m²/year
Productivity Analysis
Example Problem: A pond has GPP of 800 g C/m²/year and plant respiration of 300 g C/m²/year. Calculate NPP and determine if this ecosystem could support a fish population requiring 50 g C/m²/year.
Solution:
- NPP = GPP – R = 800 – 300 = 500 g C/m²/year
- Energy available to herbivores: 500 g C/m²/year
- Energy available to fish (secondary consumers): 500 × 0.1 = 50 g C/m²/year
- Yes, this ecosystem could just support the fish population.
9. Laboratory Applications and Experiments
Key Practical Investigations
Primary Productivity Measurement:
Use the light and dark bottle method to measure oxygen production and consumption:
- Light bottle: Measures gross photosynthesis
- Dark bottle: Measures respiration only
- Calculation: GPP = oxygen production in light bottle + oxygen consumption in dark bottle
Decomposition Rate Studies:
- Litter bag method: Place known amounts of organic matter in mesh bags
- Monitor weight loss over time under different conditions
- Vary factors: Temperature, moisture, oxygen availability
- Calculate decomposition rate: Percentage mass lost per unit time
Food Web Construction:
- Field observation: Record feeding relationships in local ecosystem
- Stomach content analysis: Examine predator diets
- Stable isotope analysis: Track energy flow through isotope ratios
- Create comprehensive food web showing all trophic connections
Biology Check: If you place litter bags in both sunny and shaded areas, which would show faster decomposition? The sunny area, because higher temperature increases microbial enzyme activity and decomposition rate.
10. Advanced Applications and Current Research
Ecosystem Management and Conservation
Restoration Ecology applies ecosystem principles to restore degraded habitats:
- Soil rehabilitation: Adding organic matter and beneficial microorganisms
- Species reintroduction: Carefully planned return of native species
- Habitat connectivity: Creating corridors between fragmented ecosystems
- Invasive species control: Removing non-native species disrupting ecosystem balance
Sustainable Agriculture uses ecosystem principles:
- Crop rotation: Maintains soil nutrients and breaks pest cycles
- Integrated pest management: Uses natural predators alongside minimal pesticides
- Agroforestry: Combines trees with crops for multiple benefits
- Cover cropping: Prevents soil erosion and adds organic matter
Biotechnology Applications
Bioremediation uses organisms to clean polluted environments:
- Bacterial degradation of oil spills
- Mycoremediation using fungi to remove heavy metals
- Phytoremediation using plants to extract contaminants from soil
Carbon Sequestration Technologies:
- Enhanced weathering: Accelerating natural carbon absorption by rocks
- Biochar production: Converting biomass to stable carbon storage
- Blue carbon projects: Protecting coastal ecosystems that store large amounts of carbon
Current Research: Scientists are developing “digital twins” of ecosystems – computer models that simulate ecosystem processes in real-time. These models help predict how ecosystems will respond to climate change and guide conservation efforts.
Practice Problems Section
Multiple Choice Questions
1. In an ecosystem, the 10% rule refers to:
a) 10% of species are producers
b) 10% of energy is transferred to the next trophic level
c) 10% of biomass is lost during respiration
d) 10% of nutrients are recycled
Solution: b) 10% of energy is transferred to the next trophic level. The 10% rule states that on average, only about 10% of energy from one trophic level is available to the next level due to metabolic losses, heat production, and incomplete consumption.
2. Which pyramid can never be inverted?
a) Pyramid of numbers
b) Pyramid of biomass
c) Pyramid of energy
d) All can be inverted
Solution: c) Pyramid of energy. Energy pyramids are always upright because energy flow follows the laws of thermodynamics – energy is always lost at each trophic level and cannot be created or recycled.
3. The major reservoir of phosphorus in the biosphere is:
a) Atmosphere
b) Ocean water
c) Sedimentary rocks
d) Living organisms
Solution: c) Sedimentary rocks. Unlike carbon and nitrogen, phosphorus has no significant atmospheric component. The major reservoir is phosphate rocks and ocean sediments.
Short Answer Questions
4. Explain why food chains rarely exceed 4-5 trophic levels.
Solution: Food chains are limited by energy availability. Due to the 10% rule, energy decreases dramatically at each trophic level. Starting with 10,000 units of energy at the producer level:
- Primary consumers: 1,000 units
- Secondary consumers: 100 units
- Tertiary consumers: 10 units
- Quaternary consumers: 1 unit
By the 4th or 5th level, there’s insufficient energy to support viable populations of consumers.
5. Compare the carbon and phosphorus cycles, highlighting three major differences.
Solution:
- Atmospheric component: Carbon has a major atmospheric reservoir (CO₂), while phosphorus has virtually no gaseous phase
- Cycling speed: Carbon cycles relatively quickly through photosynthesis and respiration, while phosphorus cycles very slowly through geological processes
- Limiting factor: Carbon is rarely limiting for plant growth, while phosphorus often limits productivity in terrestrial and aquatic ecosystems
Case Study Analysis
6. A small lake shows the following characteristics:
- High algae growth
- Low oxygen levels in deeper water
- Fish kills occurring regularly
- Nearby agricultural runoff
Analyze this situation and propose management solutions.
Solution: This lake is experiencing eutrophication caused by nutrient pollution, likely phosphorus and nitrogen from agricultural runoff. The excess nutrients trigger algal blooms that consume oxygen during decomposition, creating hypoxic conditions that kill fish.
Management solutions:
- Source control: Implement buffer strips around the lake to filter runoff
- Nutrient reduction: Work with farmers to reduce fertilizer application or switch to slow-release formulations
- Biological control: Introduce algae-eating fish or beneficial bacteria
- Physical removal: Manually remove excess algae during bloom periods
- Watershed management: Implement comprehensive land-use planning to prevent future nutrient loading
Data Analysis Questions
7. The following data shows primary productivity in different ecosystems:
| Ecosystem | GPP (g/m²/year) | NPP (g/m²/year) |
|---|---|---|
| Tropical rainforest | 4500 | 2200 |
| Temperate grassland | 2000 | 1200 |
| Desert | 200 | 90 |
| Tundra | 400 | 140 |
Calculate the percentage of GPP used in respiration for each ecosystem and explain the pattern.
Solution:
Respiration = GPP – NPP
Percentage respiration = (Respiration/GPP) × 100
- Tropical rainforest: (4500-2200)/4500 × 100 = 51%
- Temperate grassland: (2000-1200)/2000 × 100 = 40%
- Desert: (200-90)/200 × 100 = 55%
- Tundra: (400-140)/400 × 100 = 65%
Pattern: Tundra shows highest respiratory losses due to low temperature limiting photosynthetic efficiency. Desert shows high losses due to water stress. Tropical rainforest and grassland show more efficient energy capture and storage.
Experimental Design Questions
8. Design an experiment to test how temperature affects decomposition rate.
Solution:
Hypothesis: Higher temperatures increase decomposition rate due to increased microbial enzyme activity.
Materials: Standardized leaf litter, mesh bags, balance, thermometers, incubators/climate chambers
Method:
- Preparation: Dry and weigh identical amounts of leaf litter, place in mesh bags
- Temperature treatments: Set up 4 temperature conditions (10°C, 20°C, 30°C, 40°C)
- Controls: Keep all other factors constant (moisture, oxygen, pH, light)
- Replication: Use 5 bags per temperature treatment
- Data collection: Weigh bags weekly for 8 weeks, calculate mass loss
- Analysis: Plot decomposition rate vs. temperature, perform statistical analysis
Expected results: Decomposition rate should increase with temperature up to an optimal point, then potentially decrease at very high temperatures.
Diagram-Based Questions
9. Energy flow diagram showing sun → producers → primary consumers → secondary consumers → decomposers, with numerical values at each level
Based on the diagram, calculate:
a) Energy transfer efficiency between trophic levels
b) Total energy lost as heat at the secondary consumer level
c) Percentage of original solar energy reaching secondary consumers
Solution:
Given data from diagram:
- Solar energy: 100,000 kcal
- Producers: 10,000 kcal
- Primary consumers: 1,000 kcal
- Secondary consumers: 100 kcal
a) Energy transfer efficiency:
- Producers to primary consumers: (1,000/10,000) × 100 = 10%
- Primary to secondary consumers: (100/1,000) × 100 = 10%
b) Energy lost as heat at secondary consumer level:
- Energy received: 1,000 kcal
- Energy transferred up: 100 kcal
- Energy lost as heat: 1,000 – 100 = 900 kcal
c) Percentage reaching secondary consumers:
- (100/100,000) × 100 = 0.1% of original solar energy
Application Problems
10. A forest ecosystem is converted to agricultural land. Predict and explain three major changes in:
a) Energy flow patterns
b) Nutrient cycling
c) Species diversity
Solution:
a) Energy flow changes:
- Reduced primary productivity: Agricultural crops typically have lower GPP than forest trees
- Simplified trophic structure: Fewer trophic levels due to reduced biodiversity
- External energy inputs: Agricultural systems require fossil fuel energy for machinery, fertilizers, and pesticides
b) Nutrient cycling changes:
- Accelerated nutrient loss: Crop harvesting removes nutrients that would naturally cycle back
- Disrupted decomposition: Less organic matter input from reduced plant diversity
- Artificial nutrient inputs: Dependence on external fertilizers to maintain productivity
c) Species diversity changes:
- Dramatic reduction: Monoculture crops support far fewer species than diverse forests
- Loss of specialist species: Many forest species cannot survive in agricultural environments
- Increased edge effects: Fragmentation creates boundary conditions favoring generalist species
Exam Preparation Strategies
Understanding Question Patterns
CBSE Class 12 Biology exams typically include several question types for ecosystem topics:
1-2 Mark Questions: Focus on definitions, examples, and basic concepts
- Define ecological pyramid with example
- Name two factors affecting primary productivity
- Distinguish between GPP and NPP
3 Mark Questions: Require explanations and comparisons
- Explain the 10% rule with suitable example
- Compare grazing and detritus food chains
- Describe factors affecting decomposition rate
5 Mark Questions: Demand detailed analysis and application
- Explain energy flow in ecosystems with diagram
- Describe carbon cycle and human impacts
- Analyze the significance of decomposers in ecosystem functioning
Key Concepts for Memorization
Essential Definitions:
- Ecosystem: Self-sustaining unit consisting of biotic and abiotic components with energy flow and nutrient cycling
- Productivity: Rate of biomass production per unit area per unit time
- Decomposition: Breakdown of complex organic matter into simpler inorganic substances
- Food web: Network of interconnected food chains in an ecosystem
Important Formulas:
- NPP = GPP – R (Respiration)
- Energy transfer efficiency = (Energy at higher level/Energy at lower level) × 100
- Decomposition rate = (Initial mass – Final mass)/Initial mass × 100
Historical Context: Eugene Odum’s work in the 1950s established ecosystem ecology as a quantitative science. His textbook “Fundamentals of Ecology” introduced the concept of energy flow and trophic levels that form the foundation of modern ecosystem understanding.
Common Mistakes to Avoid
1. Confusing energy flow with nutrient cycling
- Energy flows unidirectionally (sun → heat)
- Nutrients cycle continuously (soil → plants → animals → soil)
2. Misunderstanding pyramid inversions
- Only biomass and number pyramids can be inverted
- Energy pyramids are always upright
3. Calculation errors in productivity problems
- Always specify units (g/m²/year or kcal/m²/year)
- Remember to subtract respiration when calculating NPP
4. Incomplete food web analysis
- Include decomposers in all food webs
- Show multiple feeding relationships, not just linear chains
Conclusion and Next Steps
Understanding ecosystems provides you with a powerful lens for viewing the natural world and human impacts on it. The concepts you’ve mastered in this chapter – energy flow, nutrient cycling, productivity, and decomposition – form the foundation for understanding global challenges like climate change, biodiversity loss, and sustainable development.
As you prepare for your CBSE Class 12 Biology exam, remember that ecosystem questions often integrate multiple concepts. Practice connecting energy flow with food webs, linking productivity with environmental factors, and relating human activities to ecosystem disruption. The numerical problems may seem challenging initially, but they follow logical patterns based on fundamental ecological principles.
Beyond your board exam, these ecosystem concepts are increasingly relevant for career opportunities in environmental science, conservation biology, sustainable agriculture, and biotechnology. Many current research areas – from carbon sequestration technologies to ecosystem restoration – build directly on the principles you’ve learned.
Next Steps for Deeper Learning:
- Explore local ecosystems: Visit nearby forests, wetlands, or agricultural areas to observe ecosystem principles firsthand
- Follow current research: Read about ecosystem studies in journals like Ecology and Ecosystems
- Consider advanced topics: Investigate ecosystem modeling, remote sensing applications, and landscape ecology
- Connect to other chapters: Link ecosystem concepts to biodiversity (Chapter 15), environmental issues (Chapter 16), and biotechnology applications
Final Exam Success Tips:
- Practice drawing: Ecosystem diagrams frequently appear in exams
- Memorize key values: 10% rule, typical productivity values for different ecosystems
- Understand processes: Focus on mechanisms, not just outcomes
- Apply knowledge: Use ecosystem principles to analyze environmental problems
The intricate web of relationships you’ve studied in ecosystems mirrors the connections between all biology topics. As you continue your studies, you’ll find ecosystem principles appearing in molecular biology, genetics, evolution, and applied sciences. This integrated understanding will serve you well whether you pursue medicine, research, environmental management, or any field requiring systems thinking and analytical problem-solving skills.
Remember, every time you step outside, you’re entering an ecosystem shaped by millions of years of evolution and increasingly influenced by human activities. The knowledge you’ve gained makes you better equipped to understand, appreciate, and potentially help solve the environmental challenges facing our planet. Good luck with your exam preparation, and may your understanding of ecosystems inspire a lifelong appreciation for the natural world!
Recommended –